FIGURE 1. Six of the fossil cercopithecid specimens used in this study. 1, UCMP 125854, Papio izodi. 2, UCMP 125856, Papio izodi. 3, MP221, Parapapio jonesi. 4, TP9, Procercocebus antiquus. 5, MP222, Theropithecus darti. 6, STS394A, Cercopithecoides williamsi.
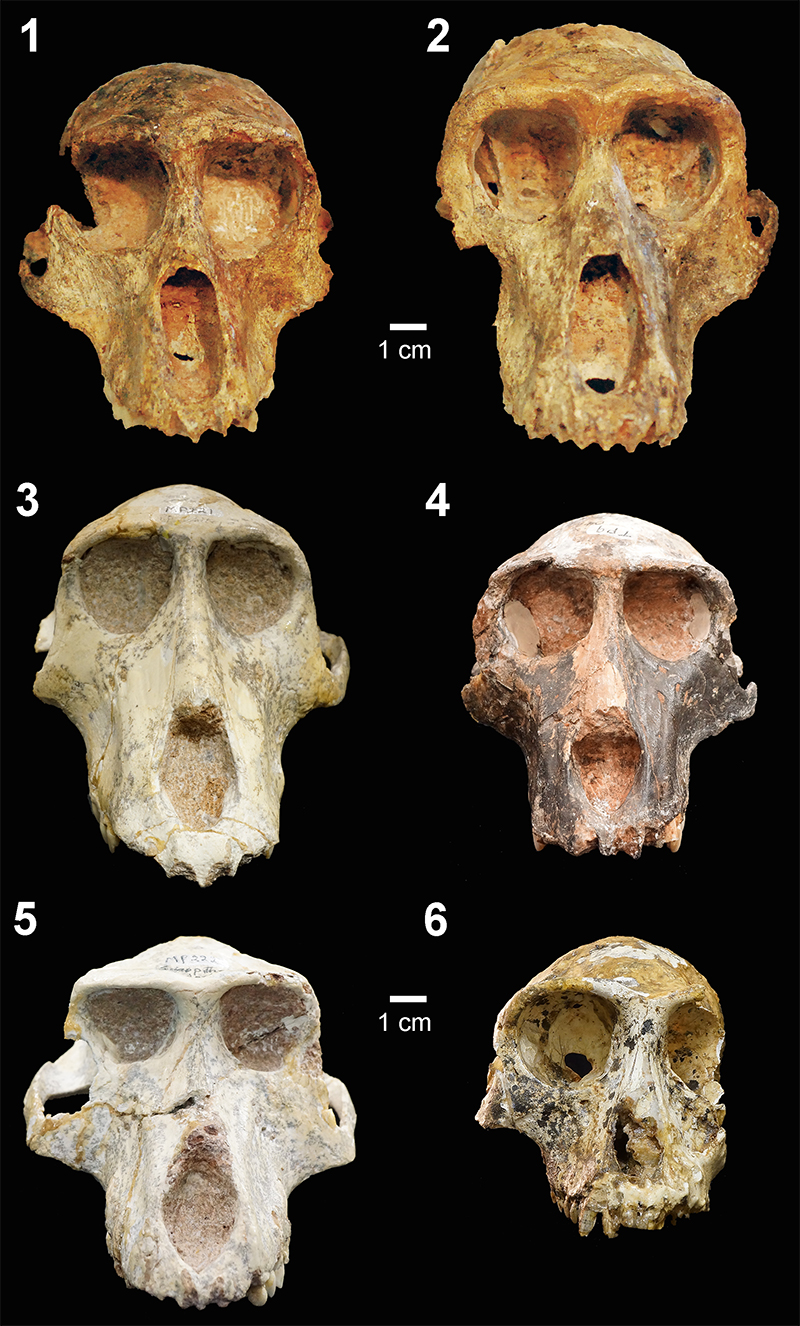
FIGURE 2. Bivariate plots of cranial measurements of extant papionins and the fossil sample. 1 and 2, Bivariate plot comparing cranial length and cranial breadth in extant papionins (1) and the fossil sample (2). 3 and 4, Bivariate plot comparing face length and muzzle width (ectomolare) in extant papionins (3) and the fossil sample (4). Note high correlations and the lack of a consistent taxonomic pattern across the distribution of fossil specimens. All bivariate correlations are significant at p < 0.0004.
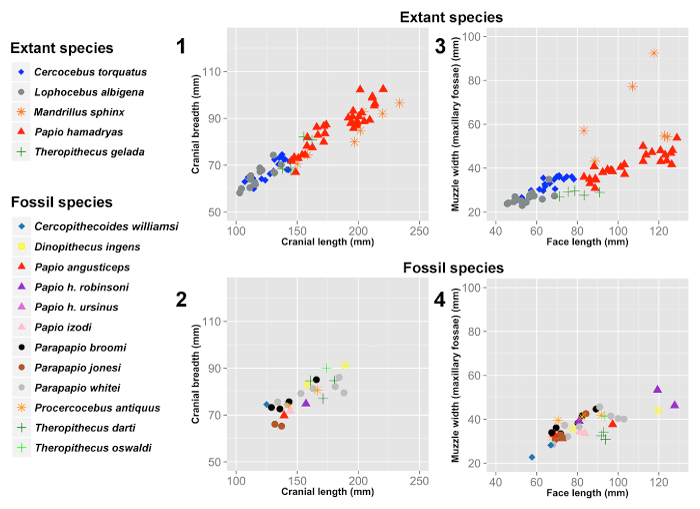
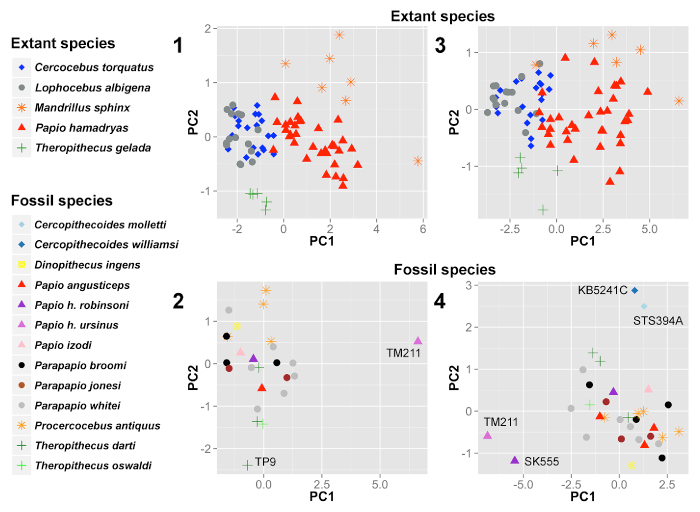
FIGURE 3. Principle components analyses (PCA) of cranial variation in extant papionins and the fossil sample. 1 and 2, PCA including maximum cranial length, orbital width, interorbital breadth, and palate length raw measurements for 81 extant papionins (1) and 25 fossil cercopithecids (2). PC1 and PC2 of the extant sample comprise 82.2% and 8.1% of the variation, respectively, and PC1 and PC2 of the fossil sample comprise 67.8% and 21.6% of the variation, respectively. Note how well the measurements discriminate extant species, and how Papio h. ursinus (TM211) and one specimen of Theropithecus darti (TP9) are distinct from the other fossils. 3 and 4, PCA including orbital width, interorbital breadth, muzzle width (ectomolare), maximum width (canine), palate width (M3), palate width (canine), and palate length in 81 extant papionins (3) and 33 fossil cercopithecids (4). PC1 and PC2 of the extant sample comprise 86.6% and 4.8% of the variation, respectively, and PC1 and PC2 of the fossil sample comprise 66.1% and 12.7% of the variation, respectively. Note how well the measurements discriminate extant species, and that Cercopithecoides and Papio hamadryas are distinct from the other fossils.