

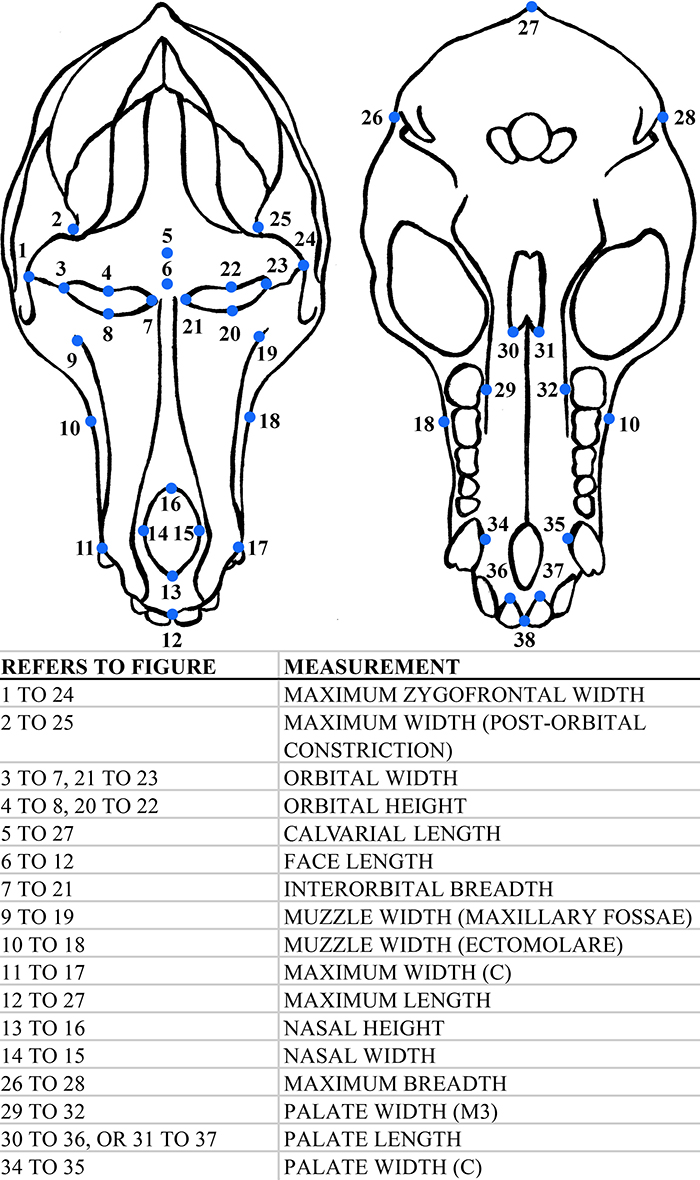
APPENDIX 1.
Generalized baboon morphology illustrating measurements taken in this study.
APPENDIX 2.
Raw data for fossils used in this study. A single set of parentheses indicates that the measurement was estimated with a high degree of confidence, and the values were used in the analyses. A double set of parentheses indicates that the measurement was estimated with a low degree of confidence, and the values were not used in the analyses. (Appendixes 2-8 available as spreadsheets in zipped file.)
APPENDIX 3.
Raw data for the extant papionins used in this study. (Appendixes 2-8 available as spreadsheets in zipped file.)
APPENDIX 4.
Descriptive statistics for the cranial measurements taken in this study, by fossil species. (Appendixes 2-8 available as spreadsheets in zipped file.)
APPENDIX 5.
Full ANOVA detailing genus comparisons for raw cranial measurements across fossil genera. Shaded cells are significant at p < 0.05. (Appendixes 2-8 available as spreadsheets in zipped file.)
APPENDIX 6.
ANOVA detailing extant genus comparisons for geometric mean scaled data for a subset of cranial measurements. Shaded cells are significant at p < 0.05, n = 81. (Appendixes 2-8 available as spreadsheets in zipped file.)
APPENDIX 7.
ANOVA detailing fossil genus comparisons for geometric mean scaled data for a subset of cranial measurements. Shaded cells are significant at p < 0.05, n = 25. (Appendixes 2-8 available as spreadsheets in zipped file.)
APPENDIX 8.
Full correlation matrix detailing fossil correlations and sample size for the 17 geometric mean scaled cranial measurements. Yellow highlighted cells are significant at p < 0.0004, and grey shaded cells give sample sizes for each measurement pair. (Appendixes 2-8 available as spreadsheets in zipped file.)
