 RNames, a stratigraphical database designed for the statistical analysis of fossil occurrences – the Ordovician diversification as a case study
Article number: 20.1.1T
https://doi.org/10.26879/729
Copyright Palaeontological Association, April 2017
Author biographies
Plain-language and multi-lingual abstracts
PDF version
Submission: 6 October 2016. Acceptance: 22 March 2017
{flike id=1801}
ABSTRACT
RNames (rnames.luomus.fi/) is an open access relational database linking stratigraphic units with each other that are considered to be time-equivalent or time overlapping. RNames is also a tool to correlate among stratigraphic units. The structure of the database allows for a wide range of queries and applications. Currently three algorithms are available, which calculate a set of correlation tables with Ordovician stratigraphic units time binned into high-resolution chronostratigraphic slices (Global Ordovician Stages, Stage Slices, Time Slices).
The ease of availability of differently binned stratigraphic units and the potential to create new schemes are the main advantages and goals of RNames. Different time-binned stratigraphic units can be matched with other databases and allow for simultaneous up-to-date analyses of stratigraphically constrained estimates in various schemes. We exemplify these new possibilities with our compiled Ordovician data and analyse fossil collections of the Paleobiology Database based on the three different binning schemes. The presented diversity curves are the first sub-stage level, global, marine diversity curves for the Ordovician. A comparison among the curves reveals that differences in time slicing have a major effect on the shape of the curve. Despite uncertainties in Early and Late Ordovician diversities, our calculations confirm earlier estimates that Ordovician diversification climaxed globally during the Darriwilian stage.
Björn Kröger. Finnish Museum of Natural History, University of Helsinki, P.O. Box 44, Fi-00014, Helsinki, Finland, bjorn.kroger@helsinki.fi
Kari Lintulaakso. Finnish Museum of Natural History, University of Helsinki, P.O. Box 44, Fi-00014, Helsinki, Finland, kari.lintulaakso@helsinki.fi
Keywords: relational database; stratigraphy; time binning; palaeobiodiversity; GOBE
Final citation: Kröger, Björn and Lintulaakso, Kari. 2017. RNames, a stratigraphical database designed for the statistical analysis of fossil occurrences – the Ordovician diversification as a case study. Palaeontologia Electronica 20.1.1T: 1-12. https://doi.org/10.26879/729
palaeo-electronica.org/content/2017/1801-rnames-db
INTRODUCTION
Fossilized biotic remains occur at specific localities and in specific horizons within (mostly sedimentary) rocks. Fossils are named in a biological hierarchical taxonomic system that is based on (type) specimens. The names and their relations among each other change historically and form a shifting taxonomic topology. Organismal (and fossil) names and their historical record of synonymies and homonymies are compiled in major global databases (e.g., Global Biodiversity Information Facility (GBIF); Paleobiology Database, (PaleobioDB); Geobiodiversity database). Typically, these databases also contain information about the occurrence of fossils within the stratigraphic rock column either as absolute or relative time ranges and/or in terms of lithostratigraphic and/or biostratigraphic units. The electronically available set of fossil names and stratigraphical occurrence information allows for analyses of evolutionary, palaeoecological, and palaeobiological questions (e.g., Alroy et al., 2008). Hypotheses about time equivalence of stratigraphic units are the basis of these analyses.
Stratigraphical hypotheses are expressed in publications. These publications represent opinions within a field of historically changing taxonomy of names of geographically constrained lithological units, biostratigraphic, and chronostratigraphic units and an absolute time frame. Statistical analyses of fossil occurrences often refer non-explicitly to one or several stratigraphic opinions (compare e.g., compilations in Webby, 2004). Conversely, large databases of fossil occurrences are based on fixed stratigraphical schemes that represent snapshots in the rapidly developing science of stratigraphy. Names of rock units, bio-, and of chronostratigraphic intervals change and opinions about their correlation often differ from publication to publication. Currently no dynamic interface exists that connects published reports of fossil occurrences with published opinions about stratigraphic relations. This connection is developed either separately for each analysis by specialists in a painstaking compiling effort (e.g., Servais and Harper, 2013) or using more or less fixed schemes (e.g., PaleobioDB, PaleobioDB.org/).
RNames is an approach to overcome these problems. RNames is a relational database of names of stratigraphical units and a set of R-scripts. Each name compiled in the database is explicitly co-related to names of time-overlapping units as expressed in published opinions. Hence, each co-relation in RNames has a reference. The sum of published opinions can be used to calculate referenced correlation schemes that, in turn, can be used to analyze fossil occurrences at various up-to-date stratigraphic resolutions on global or regional scale. All data compiled in RNames are provided under a Creative Commons Attribution 4.0 International license (CC-BY-4.0). The database is open for collaboration and further development.
Herein, we exemplify the utility of RNames based on data of the Ordovician Period. The Ordovician was a time interval with a massive global increase of genus and family level marine diversity that has been coined the Great Ordovician Biodiversification Event (GOBE, Webby, 2004; Servais et al., 2010). The stratigraphical data recorded in RNames allow for the first time for a high-resolution analysis of the complete fossil collection record of the PaleobioDB to be used to construct a detailed Ordovician diversity curve.
METHODS
An Opinion based Relational Database
The core of RNames is a relational database with six main objects (Figure 1):
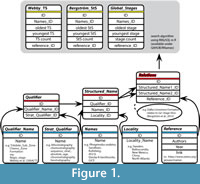 (1) Names identify stratigraphical units. A name can be a taxon, such as “ Phragmodus undatus”, a geographical name, such as “Kullsberg,” or the name of a specific time interval, such as “Sandbian.” A name in our database is also the number that specifies the absolute age of a bed, e.g., K-bentonite beds, given in m.y.r.
(2) Qualifier identifies different types of stratigraphical units. Qualifiers have two attributes: a Qualifier_Name, such as Formation, Member, Bed, or Trilobite-Zone, and a Stratigraphic_Qualifier, which identifies its underlying stratigraphic method, such as Lithostratigraphy, Chronostratigraphy, or Biostratigraphy.
(3) Location specifies the region in which the stratigraphic unit is valid, such as country, county, or continent.
(4) Structured_Names are unique combinations of a Name, Qualifier, and Location (e.g., Darriwilian | Stage | Global, or Darriwilian | Regional Stage | Australia).
(5) References are publications with Author, Year, and Title as attributes plus a link to a detailed entry in the library of the public RNames-Group of the Zotero.org Reference manager at www.zotero.org/groups/rnames.
(6) Relations contain referenced opinions about the relation of two structured names. A relation (=correlation) is a partial or complete time overlap. An example of a relation is the opinion of Sell et al. (2015) that the Dolly Ridge Formation of Virginia overlaps with the Selby Limestone Formation of New York.
Currently (09/2016) the database contains nearly 400 references, more than 4000 names, and close to 25,000 relations of exclusively Ordovician stratigraphic units.
Application of Correlation Schemes
The objects of the RNames database can be used for a wide range of correlation approaches. Currently three algorithms exist, which allow for a correlation of the set of stratigraphic units within established and standard chronostratigraphic schemes of the Ordovician Period (Ordovician Time Slices, TS, Webby et al., 2004; Ordovician Stage Slices, StS, Bergström et al., 2009; and Ordovician Global Stages, Cooper et al., 2012). The algorithms are written in R-code and are available under a GNU General Public License at github.com/bjoekroe/RNames.
At the core of the algorithms are two selector functions and six selection rules, which sort stratigraphic units into a set of time bins. The selector functions specify how a specific referenced stratigraphic opinion among several alternatives is selected. The aim of both functions is to select for the most precise correlation of a Structured_Name (e.g. the Vasalemma Formation of Estonia) with the respective chronostratigraphic scheme (e.g., Global Stages), where “precise” means the correlations that ranges through the least number of bins. Currently, we do not distinguish between regions within stratigraphic units, but correlate the general range of a unit although this is principally possible. The function compromise.selector() selects for the best compromise among different stratigraphic opinions; it selects among the opinions that correlate a Structured_Name most precisely toward time bins (e.g., Global Stages) the opinion with the highest number of references in the database. If there are, for example, two conflicting opinions about the correlation of the Vasalemma Formation to one stage either Sandbian or Katian, and the first is documented in one reference, the second in three references the compromise.selector() selects the second option.
The function youngest.selector() selects among the opinions that correlate a Structured_Name most precisely toward time bins the opinion with the most recent reference. If there are, for example, two conflicting opinions about the correlation of the Vasalemma Formation to one stage either Sandbian or Katian, and the first is documented in a reference from 2004, the second in a reference from 2015 the youngest.selector() selects the second option.
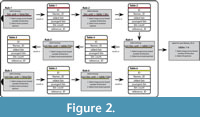 The algorithm follows a number of six successive rules or steps (Figure 2). Each rule uses one of the two selector functions, and each rule applies to stratigraphic units that are successively less directly linked (i.e., less directly related by direct opinions) to the respective time bins:
(1) In the first rule it is determined that among all opinions that relate biostratigraphic units directly to the respective time bins, the most precise one are selected via the compromise.selector(). If, i.e., the Baltoniodus alobatus conodont zone is related to the Sa1 and Sa2 Stages Slices in two references and to the Sa2 and Ka2 Stage Slice in three references, then the latter is selected for the binning into Stage Slices.
(2) The second rule says that all biostratigraphic units, which are indirectly related via other biostratigraphic units to the respective time bins are selected via the compromise.selector(). If, i.e., the Hintzeia celsaora trilobite zone is related to the Acodus deltatus / Oneotodus costatus conodont zone in three reference, which in turn is binned into the Tr2-Tr3 Stage Slices by rule 1 and to the Paracordylodus gracilis conodont zone in another paper, which in turn relates to the Tr3 Stage Slice by rule 1, then the first option is selected.
(3) The third rule determines that among all opinions that relate non-biostratigraphic units directly to the respective time bins, the most precise ones are selected via the compromise.selector().
(4) The fourth rule says that among all opinions that relate non-biostratigraphic units via biostratigraphic units to the respective time bins the most precise ones are selected via the youngest.selector().
(5) The fifth rule determines that among all non-biostratigraphic units that are indirectly linked (in the second order) via other non-biostratigraphic units to biostratigraphic units the youngest.selector() is applied.
(6) The sixth rule says that all non-biostratigraphic units that are indirectly linked (in the second order) via other non-biostratigraphic units to the respective time bins the youngest.selector() is applied.
Rules 1-3 are based on the compromise.selector() because chronostratigraphic schemes are generally based on relatively well-established biostratigraphic units (zones) and finding the best compromise between different opinions reflects the common practice of stratigraphic correlation. In contrast, correlations between lithostratigraphic units and to biostratigraphy often change over the time of stratigraphic practice, and new findings can significantly alter results.
The application of these six rules results in a number of worktables in the database, which contain the most precise correlations for each rule. These tables again are compared with each other and finally the opinions are selected, which are most precise (range across lowest number of time bins). The results of the correlations are saved in separate searchable tables at the RNames homepage (Figure 1).
Time Binning of Fossil Occurrences
The set of stratigraphical names within RNames can be matched with collections of stratigraphical names elsewhere. One example of data mining with the help of RNames is a time-binning and high-resolution diversity analysis of the fossil occurrences of the PaleobioDB. The PaleobioDB contains data of fossil collections of hundreds of thousands of taxa throughout the entire Phanerozoic. Each PaleobioDB collection record ideally includes chrono-, litho-, and biostratigraphical information that can be compared with the records in RNames. The stratigraphical data of all Ordovician fossil collections of the PaleobioDB (13478 collections; download 08/2016) were matched with the time-binned (either Global Stages, Stage Slices, or Time Slices) stratigraphical units of RNames in a R-Script that is freely available under a GNU General Public License at github.com/bjoekroe/RNames.
The PaleobioDB download contained 4943 different field entries in stratigraphic fields such as “Member,” “Zone,” or “stratigraphic comments.” Not all of these entries could be matched automatically because they are written in a non-standardized way (this holds especially for biostratigraphic zones and lithostratigraphic units and for units transcribed from Russian or Chinese), or are misspelled. These data entries needed to be manually linked with Structured_Names of RNames. The RNames table (=object) PBDB_Name contains a list of currently 2201 stratigraphic PaleobioDB field entries that cannot and/or have not been matched with Structured_Names of RNames, either manually or automatically. However, most of these entries are not relevant for high resolution binning and within RNames a tool exists for the manual linking of individual PaleobioDB field entries with Structured_Names entries to further improve the matching. Currently, less than 5% of the occurrences downloaded from the PaleobioDB cannot be matched with entries in RNames.
Diversity Calculation
All Ordovician fossil occurrences compiled within the PaleobioDB (89404 occurrences; download 05/12/2016) of all Ordovician fossil collections have been classified within the three time bin schemes (see above), which resulted in 86390 occurrences (97% of the PaleobioDB download) binned into Ordovician Time Slices, TS, (Webby et al., 2004), 86858 occurrences (97%) binned into Ordovician Stage Slices, StS (Bergström et al., 2009), and 87288 (98%) occurrences binned into Ordovician Global Stages (Cooper et al., 2012). Subsequently, all occurrences with a one- and two-time bin resolution have been selected, respectively. As a next step all genus names within this selection classified as “accepted names” within the PaleobioDB have been tabulated against the collections with one- and two-time bin resolution, respectively. These six tabulations served as the basis for a simple calculation of the mean standard diversity after Cooper et al. (2004) and a rarefaction analysis. We used R statistical software package “vegan” version 2.0-10 (Oksanen et al., 2013) for the rarefaction analysis and calculated diversities based on a quota of 600 occurrences.
RESULTS
Correlation with Automated Rules
The results of an automated correlation cannot be more than an approximation to the best knowledge we have about each particular bed. The complexity of any correlative approach can be exemplified by the current discussions about the Sandbian / Katian Stage Boundary of the Ordovician System.
The base of the Katian Stage is defined at the Black Knob Ridge, Oklahoma, USA, Global Stratotype Section and Point (GSSP) as the level 4.0 m above the base of the Bigfork Chert Formation (Goldman et al., 2007). This level coincides with the local base of the Diplacanthograptus caudatus graptolite-zone and is within the Baltoniodus alobatus conodont-subzone of the Amorphognathus tvaerensis North Atlantic Conodont-Zone (Goldman et al., 2007). The D. caudatus graptolite-zone was newly established for North America in Goldman et al. (2007) and was therein correlated with the Corynoides americanus, Orthograptus ruedemann i and Diplacanthograptus spiniferus graptolite-zones of Eastern North America. The Midcontinent conodont zonation is not established at the GSSP but described in Goldman et al. (2007) from a supplementary section c. 60 km to the West in the Arbuckle Mountains, Oklahoma. In the supplementary section the Sandbian / Katian boundary is interpreted to be within the Plectodina tenuis conodont-zone (Goldman et al., 2007).
The Sandbian / Katian boundary interval in North America and Baltoscandia is in close proximity of several prominent tephra layers (K-bentonite beds) and globally roughly correlates with a number of beds with major positive δ13C excursions. The relative position of these beds to the stage boundary is not fully resolved and as a consequence during the last several years the boundary interval has been intensively discussed (e.g., Young et al., 2005; Ainsaar et al., 2010; Bergström et al., 2010; Bergström et al., 2011; Chen et al., 2013; Pouille et al., 2013; Carlucci et al., 2015; Sell et al., 2015; Taylor and Loch, 2015; Bergström et al., 2016; Kröger et al., 2016; Quinton et al., 2016).
The partly controversial opinions expressed in these papers are compiled in RNames. The correlation algorithm of RNames resulted in a time binning that is partly in conflict with Goldman et al. (2007) and inconsistent between the different correlation approaches: 1) The Plectodina tenuis conodont-zone is correlated with the Katian Stage, with the 5c Time Slice of Webby et al. (2004), but with the Sa2 Stage Slice of Bergström et al. (2009); 2) the Baltoniodus alobatus conodont-zone is correlated with the Sandbian to Katian Stages and with the 5b-c Time Slices, but with the Sa2 Stage Slice only; 3) the Guttenberg Isotopic Carbon Excursion (GICE) is correlated with the Sandbian and Katian Stage, the 5c Time Slice, and with the Sa2 Stage Slice.
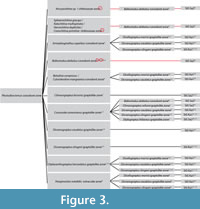 The reason for these inconsistencies can be found in the relevant literature compiled in RNames and in the different routes toward selection in the correlation algorithms: 1) the Plectodina tenuis zone e.g., is correlated in RNames with 12 biozones in eight papers (Figure 3). The 12 biozones are correlated via direct unambiguous referenced correlations and indirectly via the algorithms to either the Sa2 Stage Slice, the Ka1 Stage Slice, or to both stage slices. Hence, the eight references express opinions that can be used for time binning into either of these two time bins or into both. Because the algorithm searches for the most precise resolution, the Sa2-Ka1 correlations are culled, and because the algorithm searches for the best compromise between authors, the opinions are selected that have the most references. In this case three references express opinions that result in a correlation into the single Sa2 Stage Slice. 2) All three correlations are based on the correlation of Baltoniodus alobatus zone with the Sa2 Stage Slice according to Ainsaar et al. (2010). The correlation of Ainsaar et al. (2010) probably reflects a local peculiarity (see also Bergström et al., 2012) because in most of the global correlations (e.g., Cooper et al., 2012) and in Goldman et al. (2007) the B. alobatus zone crosses the Sandbian/Katian boundary. The opinion of Ainsaar et al. (2010) is selected by the algorithm, because it reflects the correlation with the least number of stage slices (i.e., most precise). 3) The conflicting correlations of the GICE, in turn, are a consequence of the opinion expressed in Quinton et al. (2016) to correlate the GICE with the P. tenuis and the underlying Plectodina undatus zone and its resulting time binning into Sa2 Stage Slice. In several other publications, the GICE is correlated with the earliest Katian (e.g., Goldman et al., 2007; Pouille et al., 2013). Similar problems are ubiquitous in many stratigraphic correlations. As a result any algorithm in stratigraphic correlation can only be a best approximation of the current knowledge, and differences and new reference compilations within RNames may change the time binning of individual horizons.
Ordovician High-resolution Diversity Estimates
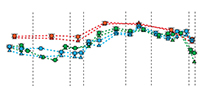
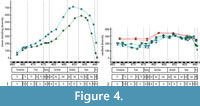 The time-binned stratigraphical names in RNames have been matched with the complete set of records of collections of the Ordovician Period of the PaleobioDB and, based on these matching simple diversity estimates were calculated at different stratigraphical resolutions (Figure 4). The resulting diversity curves illustrate the effects of the time binning and of subsampling on the estimates. All curves show a similar general pattern with a slow diversity increase during the Early Ordovician, a maximum increase during the Darriwilian, and a diversity drop during the later Katian and Hirnantian.
The subsampling of the data resulted in two main curve differences: (1) no substantial Tremadocian - Dapingian rise exists in rarefied diversity data; (2) a consistent signal of diversity drop exists in rarefied data from the late Sandbian onward.
Diversity trends differ also between stratigraphic binning schemes: (1) no consistent diversity signal exists in Floian - Dapingian rarefied data; (2) no consistent signal exists in late Sandbian - early Katian mean standing diversities. The differences in diversity trends between time-binning schemes are largest in curve sections with large differences in timing of the bins.
Additionally, potentially the quality of stratigraphic resolution has an effect on the consistency of the diversity estimates. The mean quality of stratigraphic resolution can be expressed as the mean number of correlated time bins per collection in the PaleobioDB. Most of the collections can be correlated within a one-time bin resolution. But the relative number of correlations in one-time bin resolution changes significantly across time bins, with least quality in Tremadocian - Dapingian data (Figure 5).
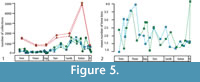 We calculated the diversity estimates either based on correlations, which fit within one-time bin (such as the Dalby Limestone of TS 5a) or based on correlations that span two-time bins (such as the Dalby Limestone of Sa1-Sa2). The culling of units that cannot be unambiguously correlated to one-time bin results in less data for the diversity analysis. In our analysis Tr3, Fl1, and Fl3, respectively, are represented by fewer than 100 collections of the PaleobioDB (Figure 5). Diversity estimates have not been calculated for these poorly represented time bins in one-time bin resolution. However, when stratigraphic units that span two time bins are not culled, the same collections can be included into the analysis. We compared the one-time bin and the two-time bin approach by calculating correlation coefficients after generalized differencing in order to reduce effects of autocorrelation (McKinney, 1990; Alroy, 2000; Novack-Gottshall and Miller, 2016). The resulting coefficients support our null hypothesis that both curves are statistically indistinguishable (Table 1).
DISCUSSION
The three published tables with time-binned stratigraphic units contain the results of the selection algorithm and list correlated stratigraphic units, the resolution (number of time bins) of the correlation, and the references (rnames.luomus.fi/index.php/search-bergstroem-stage-slices; rnames.luomus.fi/index.php/search-time-slices; rnames.luomus.fi/index.php/search-stages). The binnings of individual stratigraphic units are in several cases conflicting in between the three tables (i.e., stratigraphic binning schemes). Some units are correlated, for instance, into an early Katian time bin in one table and into a late Sandbian time in another table. The differences are caused by conflicting published opinions about stratigraphical correlations, and by differences in the routes toward the final correlation within the binning algorithm (see above). The structure of the RNames database allows for the development of alternative binning algorithms in the future, which potentially will result in fewer conflicts or those which are optimised for special needs. The existing algorithm should only be seen as a first approach and as a general demonstration of the possibilities of RNames.
We used the three correlation tables for the time binning of the PaleobioDB collections and a subsequent calculation of simple diversity estimates. The resulting diversity trajectories are broadly similar with a maximum diversity increase during the Middle Ordovician, and a trend of diversity decrease during the Late Ordovician, but differ in detail. The trends are inconsistent for the Floian - Dapingian interval, and for the late Sandbian - early Katian interval. This is probably not as much a result of problems of stratigraphic correlation and/or a lower quality of the stratigraphical data, but instead a result of differences in the absolute and relative timing of the bins in the different binning schemes. The inconsistencies are not linked to the quality of the resolution (one-time bin or two-time bin minimum resolution) (Table 1) or to the general quality of the correlation (Figure 5). But it is apparent that in intervals with equally timed bins the diversity trends are more similar to each other (Figure 4). Hence, it is the choice of the correlation scheme, which is most important for the calculation and interpretation of time-binned estimates.
This result of our analysis is important when comparing published diversity curves that are based on different time bins. Until now, only few high-resolution total marine Ordovician diversity curves have been published (Sepkoski, 1995; Miller and Foote, 1996; Connolly and Miller, 2002). These curves are based either on the British Series (Sepkoski, 1995; Miller and Foote, 1996) or on c. 8 myr time bins and differ in some aspects from the curves published herein.
The main differences between the earlier approaches and the curves published herein are the extent of the Ordovician diversity plateau and the subsequent start of the Late Ordovician diversity fall. In our new calculations the diversity climaxed during the Sandbian, reached an intermediate maximum during the late Katian and drastically decreased during the Hirnantian. In the earlier calculations the Ordovician diversity climax is reached in the Middle Ordovician Llanvirn (=late Darriwilian) (Miller and Foote, 1996) or in the Late Ordovician Ashgillian (=late Katian-Hirnantian) (Sepkoski, 1995) of the British terminology, respectively, which are not properly defined at global scale.
The time bin resolution applied herein is significantly higher, and the boundaries between time bins are not congruent. We interpret the resulting differences mainly as an effect of different time binning. Nevertheless, one feature, the massive Darriwilian diversity increase, is robust and visible in almost all published curves (see Connolly and Miller, 2002). This is congruent with, and supports, other recent findings that the GOBE climaxed during the Darriwilian (Rasmussen et al. 2016; Trubovitz and Stigall, 2016)
SUMMARY
RNames is a tool to correlate among stratigraphic units. The structure of the database allows for a wide range of queries and applications. Currently three algorithms are available, which calculate a set of correlation tables with Ordovician stratigraphic units time binned into high-resolution chronostratigraphic slices (Time Slices, Webby et al., 2004; Stage Slices, Bergström et al., 2009; and Global Stages, Cooper et al., 2012).
The ease of availability of differently binned stratigraphic units and the potential to create new schemes is one of the main advantages and aims of RNames. Different time-binned stratigraphic units can be matched with other databases and allow for simultaneous up-to-date analyses of stratigraphically constrained estimates at various resolutions and in various schemes.
We exemplified these new possibilities with our compiled Ordovician data and analyzed fossil collections of the PaleobioDB based on the three different binning schemes. The presented diversity curves are the first sub-stage level global marine diversity curves for the Ordovician. The curves confirm a Darriwilian diversification maximum and a Sandbian diversity climax; detected in earlier global total marine Ordovician estimates and provide evidence for a global major diversity fall beginning early in the Katian. A comparison among published and new curves reveals that differences in time slicing have the most significant effect on the shape of the curve.
The correlation tables and the underlying data are provided under a Creative Commons Attribution 4.0 International license (CC-BY-4.0) and the code is published under a GNU General Public License, and it is anticipated that in the near future a growing number of collaborators will improve the database, the data content and the functionality.
ACKNOWLEDGEMENTS
We are indebted for the support by the Deutsche Forschungsgemeinschaft (grant KR, 2095/7-1). We are grateful for the technical support from Dare Talvitie (Finnish Museum of Natural History, University of Helsinki) and for the help in data compilation by S. Scholze (Helsinki). This paper is a contribution to the IGCP 653 project “The onset of the Great Ordovician Biodiversity Event.”
REFERENCES
Ainsaar, L., Kaljo, D., Martma, T., Meidla, T., Männik, P., Nõlvak, J., and Tinn, O. 2010. Middle and Upper Ordovician carbon isotope chemostratigraphy in Baltoscandia: A correlation standard and clues to environmental history. Palaeogeography, Palaeoclimatology, Palaeoecology, 294:189-201.
Alroy, J. 2000. New methods for quantifying macroevolutionary patterns and processes. Paleobiology, 26:707-733.
Alroy, J., Aberhan, M., Bottjer, D.J., Foote, M., Fursich, F.T., Harries, P.J., Hendy, A.J., Holland, S.M., Ivany, L.C., Kiessling, W., Kosnik, M.A., Marshall, C.R., McGowan, A.J., Miller, A.I., Olszewski, T.D., Patzkowsky, M.E., Peters, S.E., Villier, L., Wagner, P.J., Bonuso, N., Borkow, P.S., Brenneis, B., Clapham, M.E., Fall, L.M., Ferguson, C.A., Hanson, V.L., Krug, A.Z., Layou, K.M., Leckey, E.H., Nurnberg, S., Powers, C.M., Sessa, J.A., Simpson, C., Tomasovych, A., and Visaggi, C.C. 2008. Phanerozoic trends in the global diversity of marine invertebrates. Science, 321:97-100.
Bergström, S.M., Chen, X., Gutiérrez-Marco, J.C., and Dronov, A. 2009. The new chronostratigraphic classification of the Ordovician System and its relation to major regional series and stages and to δ13C chemostratigraphy. Lethaia, 42:97-107.
Bergström, S.M., Eriksson, M.E., Schmitz, B., Young, S.A., and Ahlberg, P. 2016. Upper Ordovician δ13C org chemostratigraphy, K-bentonite stratigraphy, and biostratigraphy in southern Scandinavia: A reappraisal. Palaeogeography, Palaeoclimatology, Palaeoecology, 454:175-188.
Bergström, S.M., Lehnert, O., Calner, M., and Joachimski, M.M. 2012. A new upper Middle Ordovician-Lower Silurian drillcore standard succession from Borenshult in Östergötland, southern Sweden: 2. Significance of δ13C chemostratigraphy. GFF, 134:39-63.
Bergström, S.M., Schmitz, B., Young, S.A., and Bruton, D.L. 2011. Lower Katian (Upper Ordovician) δ13C chemostratigraphy, global correlation and sea-level changes in Baltoscandia. GFF, 133:31-47.
Bergström, S.M., Young, S., and Schmitz, B. 2010. Katian (Upper Ordovician) δ13C chemostratigraphy and sequence stratigraphy in the United States and Baltoscandia: A regional comparison. Palaeogeography, Palaeoclimatology, Palaeoecology, 296:217-234.
Carlucci, J.R., Goldman, D., Brett, C.E., Westrop, S.R., and Leslie, S.A. 2015. Katian GSSP and Carbonates of the Simpson and Arbuckle Groups in Oklahoma. Stratigraphy, 12(3-4), Online Supplement:144-202
Chen, X., Bergström, S.M., Zhang, Y., and Wang, Z. 2013. A regional tectonic event of Katian (Late Ordovician) age across three major blocks of China. Chinese Science Bulletin, 58:4292-4299.
Connolly, S.R. and Miller, A.I. 2002. Global Ordovician Faunal Transitions in the Marine Benthos: Ultimate Causes. Paleobiology, 28:40-26.
Cooper, R.A. 2004. Measures of Diversity, p. 52-57. In Webby, B.D., Paris, F., Droser, M., and Percival, I., (eds.), The Great Ordovician Biodiversification Event. Columbia University Press, New York.
Cooper, R.A., Sadler, P.M., Hammer, Ø., and Gradstein, F.M. 2012. Chapter 20 - The Ordovician Period, p. 489-523. In Gradstein, F.M., Schmitz, J.G.O.D., and Ogg, G.M., (eds.), The Geologic Time Scale 2012. Elsevier, Boston.
Goldman, D., Leslie, S.A., Nõlvak, J., Young, S., Bergström, S.M., and Huff, W.D. 2007. The Global Stratotype Section and Point (GSSP) for the base of the Katian Stage of the Upper Ordovician Series at Black Knob Ridge, Southeastern Oklahoma, USA. Episodes, 30:258-270.
Kanygin, A.V., Koren, T.N., Vadrenkina, A.G., Timokhin, A.V., Sychev, O.V., and Tolmacheva, T.Y. 2010. Ordovician of the Siberian Platform. Geological Society of America Special Papers, 466:106-117.
Korén, T.N., Tolmacheva, T.Y., Sobolevskaya, E.G., Raevskaya, O.T., and Obut, O.T. 2006. Ordovician System, p. 31-47. In Korén, T.N., ed. Biozonal stratigraphy of the Phanerozoic in Russia. VSEGEI, St. Petersburg.
Kröger, B., Hints, L., and Lehnert, O. 2016. Ordovician reef and mound evolution: the Baltoscandian picture. Geological Magazine: dx.doi.org/10.1017/S0016756816000303.
Lehnert, O., Miller, J.F., Leslie, S.A., Repetski, J.E., and Ethington, R.L. 2005. Cambro-Ordovician sea level fluctuations and sequence boundaries: The missing record and the evolution of new taxa. Special Papers in Palaeontology, 73:117-134.
McKinney, F.K. 1990. Classifying and analyzing evolutionary trends, p. 28-58. In McNamara, K.J. (ed.), Evolutionary Trends. University of Arizona Press, Tucson.
Miller, A.I. and Foote, M. 1996. Calibrating the Ordovician radiation of marine life: implications for the Phanerozoic diversity trends. Paleobiology, 22:304-309.
Novack-Gottshall, P.M. and Miller, A.I. 2016. Comparative geographic and environmental diversity dynamics of gastropods and bivalves during the Ordovician Radiation. Paleobiology, 29:576-604.
Pouille, L., Delabroye, A., Vandenbroucke, T.R.A., Calner, M., Lehnert, O., Vecoli, M., and Danelian, T. 2013. Chitinozoan biostratigraphy across the Katian (Late Ordovician) GICE event in the Borenshult-1 drillcore (Sweden). Review of Palaeobotany and Palynology, 198:134-144.
Oksanen, J., Guillaume Blanchet, F., Kindt, R., Legendre, P., Minchin, P.R., O’Hara, R.B., Simpson, G.L., Peter, S., Stevens, H.H., and Wagner, H. 2013. Vegan: Community Ecology Package. CRAN.R-project.org/package=vegan
Quinton, P.C., Herrmann, A.D., Leslie, S.A., and MacLeod, K.G. 2016. Carbon cycling across the southern margin of Laurentia during the Late Ordovician. Palaeogeography, Palaeoclimatology, Palaeoecology, 458:63-76.
Rasmussen, C.M.Ø., Ullmann, C.V., Jakobsen, K.G., Lindskog, A., Hansen, J., Hansen, T., Eriksson, M.E., Dronov, A., Frei, R., Korte, C., Nielsen, A.T., and Harper, D.A.T. 2016. Onset of main Phanerozoic marine radiation sparked by emerging Mid Ordovician icehouse. Scientific Reports, 6: Article 18884.
Saltzman, M.R., Edwards, C.T., Leslie, S.A., Dwyer, G.S., Bauer, J.A., Repetski, J.E., Harris, A.G., and Bergström, S.M. 2014. Calibration of a conodont apatite-based Ordovician 87Sr/86Sr curve to biostratigraphy and geochronology: Implications for stratigraphic resolution. Geological Society of America Bulletin, 126:1551-1568.
Sell, B.K., Samson, S.D., Mitchell, C.E., McLaughlin, P.I., Koenig, A.E., and Leslie, S.A. 2015. Stratigraphic correlations using trace elements in apatite from Late Ordovician (Sandbian-Katian) K-bentonites of eastern North America. Geological Society of America Bulletin,
Sennikov, N.V., Lykova, E.V., Obut, O.T., Tolmacheva, T.Y., and Izokh, N.G. 2014. The new Ordovician stage standard as applied to the stratigraphic units of the western Altai-Sayan Folded Area. Russian Geology and Geophysics, 55:971-988.
Sepkoski, J.J. 1995. The Ordovician Radiations: diversification and extinction shown by global genus-level taxonomic data. p. 393-396. In Cooper, J.D., Droser, M.L., and Finney, S.C. (eds.), Ordovician odyssey: short papers for the Sevenths International Symposium on the Ordovician System, Pacific Section Society for Sedimentary Geology (SEPM), Las Vegas, Nevada, USA.
Servais, T. and Harper, D.A.T. (eds.) 2013. Early Palaeozoic Biogeography and Palaeogeography. Geological Society, London, Memoirs, 38:476 pp.
Servais, T., Owen, A.W., Harper, D.A.T., Kröger, B., and Munnecke, A. 2010. The Great Ordovician Biodiversification Event (GOBE): The palaeoecological dimension. Palaeogeography, Palaeoclimatology, Palaeoecology, 294:99-119.
Sweet, W.C. 1984. Graphic correlation of upper Middle and Upper Ordovician rocks, North American midcontinent province, USA, p. 23-35. In Bruton, D.L. (ed.), Aspects of the Ordovician System. Universitetsforlaget, Oslo.
Taylor, J.F. and Loch, J.D. 2015. Post-Meeting Field Trip: The Central Appalachians. Field Trip Guidebook for: The Ordovician Exposed: 12th International Symposium on the Ordovician System, Stratigraphy, 12, Online Supplement : 1-117.
Trubovitz, S. and Stigall, A.L. 2016. Synchronous diversification of Laurentian and Baltic rhynchonelliform brachiopods: Implications for regional versus global triggers of the Great Ordovician Biodiversification Event. Geology, 44:743-746.
Webby, B.D. 2004. Introduction, p. 1-37. In Webby, B.D., Paris, F., Droser, M., and Percival, I., (eds.), The Great Ordovician Biodiversification Event. Columbia University Press, New York.
Webby, B.D., Cooper, R.A., Bergström, S.M., and Paris, F. 2004. Stratigraphic framework and time slices, p. 41-51. In Webby, B.D., Paris, F., Droser, M., and Percival, I., (eds.), The Great Ordovician Biodiversification Event. Columbia University Press, New York.
Young, S.A., Saltzman, M.R., and Bergström, S.M. 2005. Upper Ordovician (Mohawkian) carbon isotope (δ13C) stratigraphy in eastern and central North America:Regional expression of a perturbation of the global carbon cycle. Palaeogeography, Palaeoclimatology, Palaeoecology, 222:53-76.
