FIGURE 1. Terminology of molars. Figures represent left-hand molars.
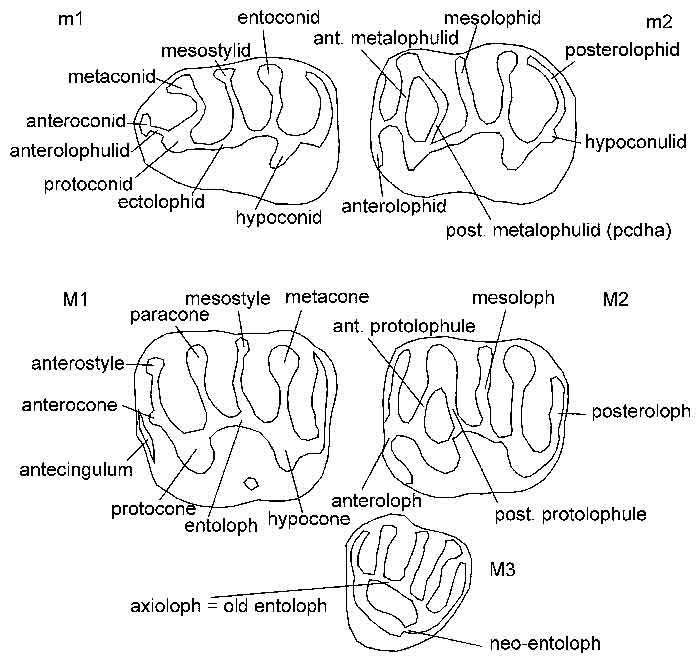
FIGURE 2. Distribution of morphology values of protoconid hind arm in m2 (filled circles) and protolophule in M2 (open circles). Enclosing circles and connecting lines indicate possible relationships.
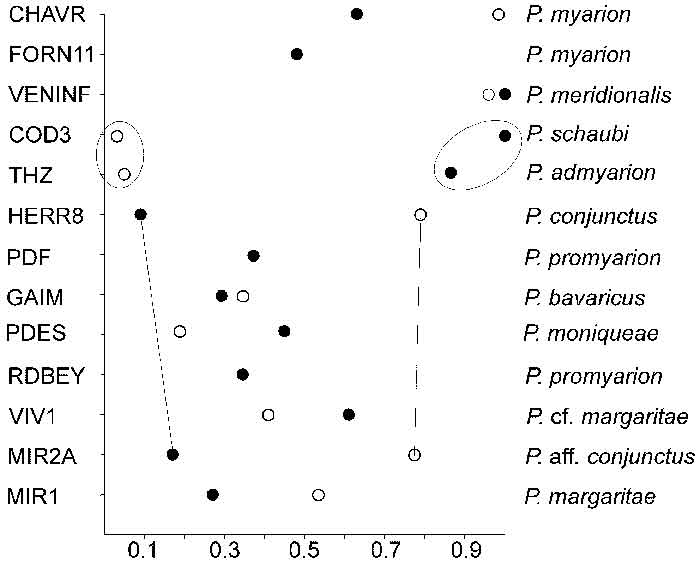
FIGURE 3. Plesiosminthus margaritae n. sp. from Mirambueno 1 (occlusal views). 1, m1 sin., RGM 558099; 2, m2 sin., MIR1 168; 3, m3 sin., RGM 558149; 4, M1 sin., RGM 558200; 5, M2 sin., MIR1 189; 6, M3 sin., MIR1 196; 7, m1 dext., RGM 558105; 8, m2 dext., RGM 558138; 9, m3 dext., MIR1 178; 10, M1 dext., MIR1 187; 11, M2 dext., MIR1 193 (Holotype); and 12, M3 dext., MIR1 197.
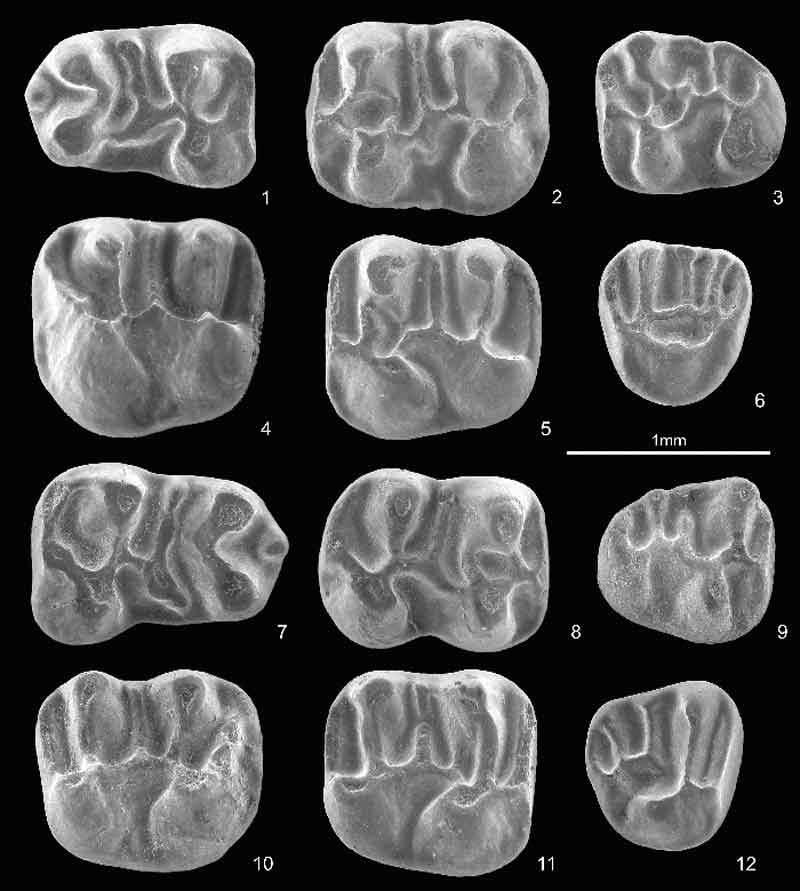
FIGURE 4. Scatter diagrams of molar length (L) and width (W) of Plesiosminthus margaritae n. sp. from Mirambueno 1 (in mm). 1, m1; 2, m2; 3, m3; 4, M1; 5, M2; and 6, M3.
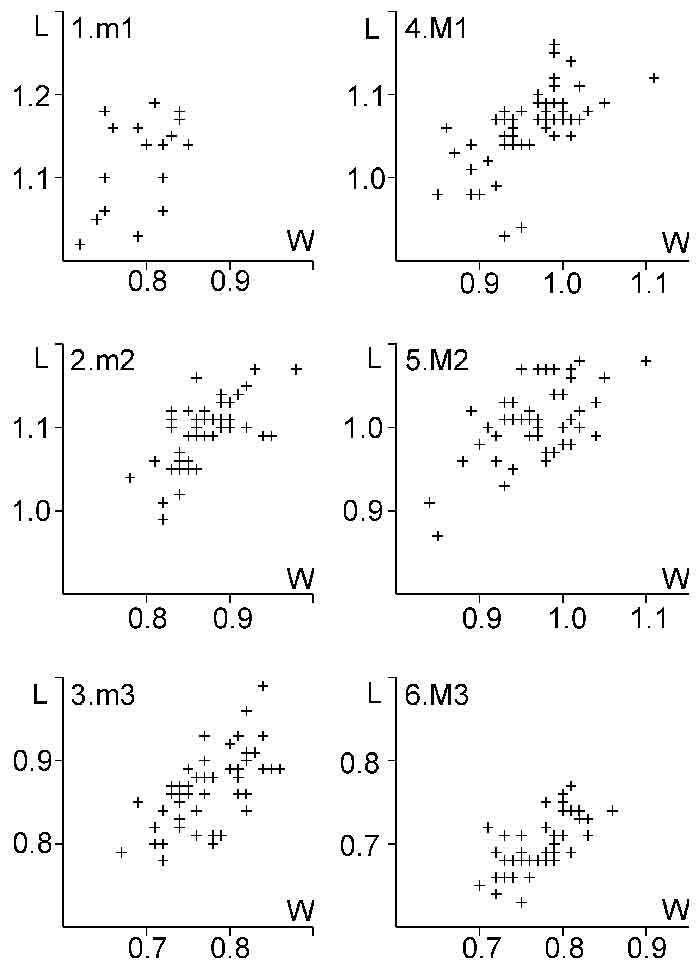
FIGURE 5. Scatter diagrams of molar length (L) and width (W) of Plesiosminthus cf. margaritae n. sp. from Vivel del Río 1 (in mm). 1, m1; 2, m2; 3, m3; 4, M1; 5, M2; and 6, M3.
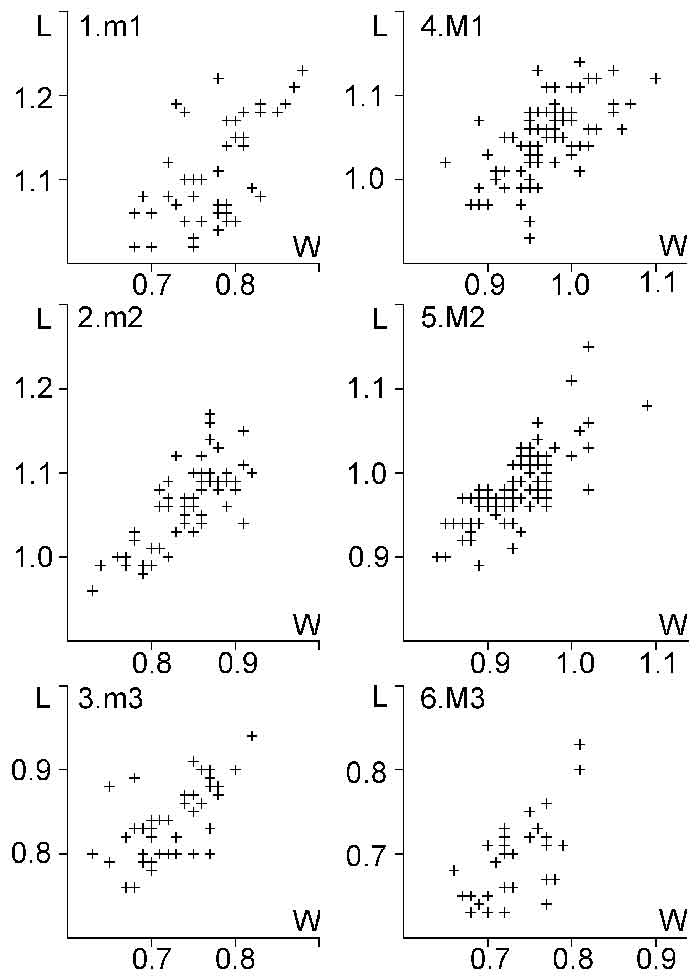
FIGURE 6. Scatter diagrams of molar length (L) and width (W) of Plesiosminthus aff. conjunctus (cross) and Plesiosminthus sp. (circle) from Mirambueno 2A, compared with the distribution area (rectangle) of Plesiosminthus conjunctus molars from HERR8 (in mm). 1, m1; 2, m2; 3, m3; 4, M1; 5, M2; and 6, M3.
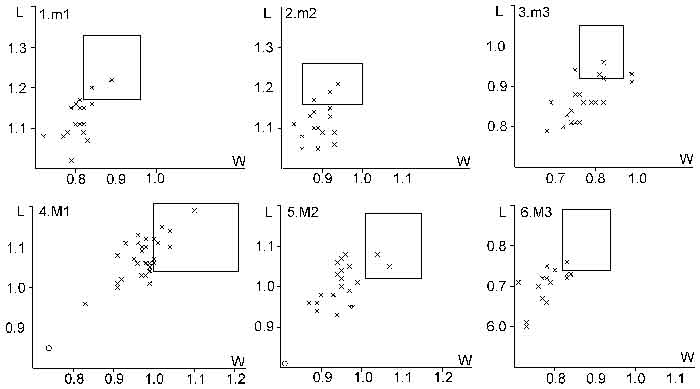
FIGURE 7. m1 length (1) and width (2) of Plesiosminthus species. The bars represent the minimum and maximum in mm, a tick marks the mean, and the number of specimens is given to the right.
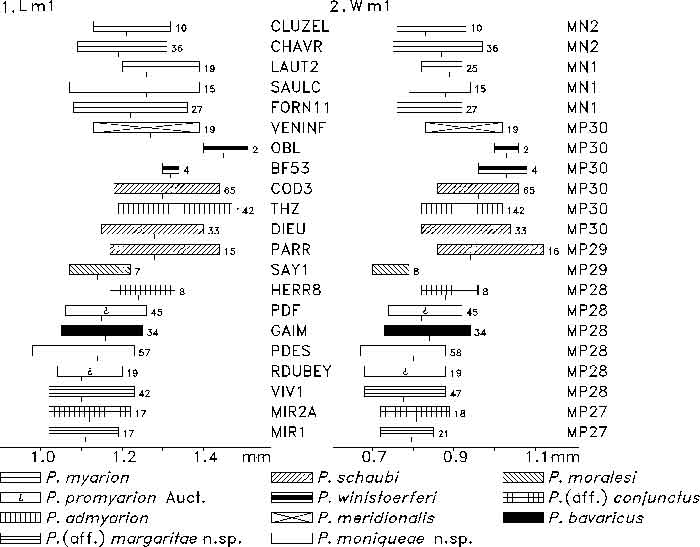
FIGURE 8. m2 length (1) and width (2) of Plesiosminthus species. The bars represent the minimum and maximum in mm, a tick marks the mean, and the number of specimens is given to the right.
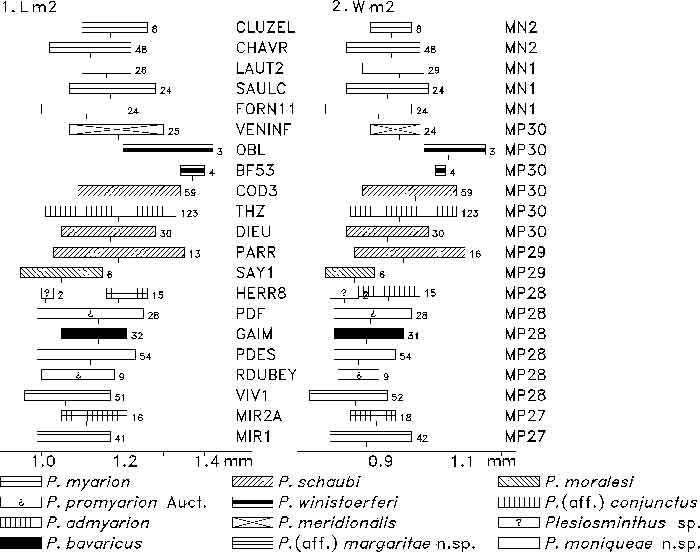
FIGURE 9. m3 length (1) and width (2) of Plesiosminthus species. The bars represent the minimum and maximum in mm, a tick marks the mean, and the number of specimens is given to the right.
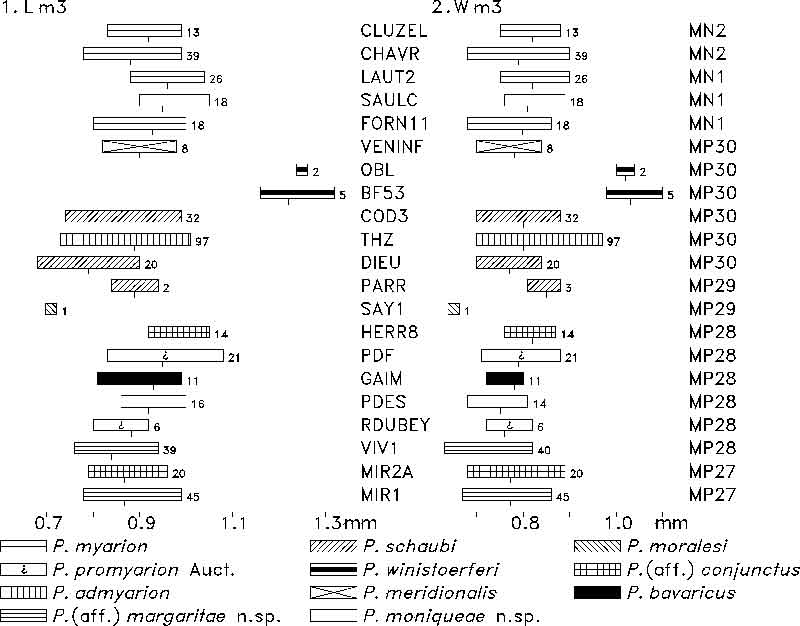
FIGURE 10. M1 length (1) and width (2) of Plesiosminthus species. The bars represent the minimum and maximum in mm, a tick marks the mean, and the number of specimens is given to the right.
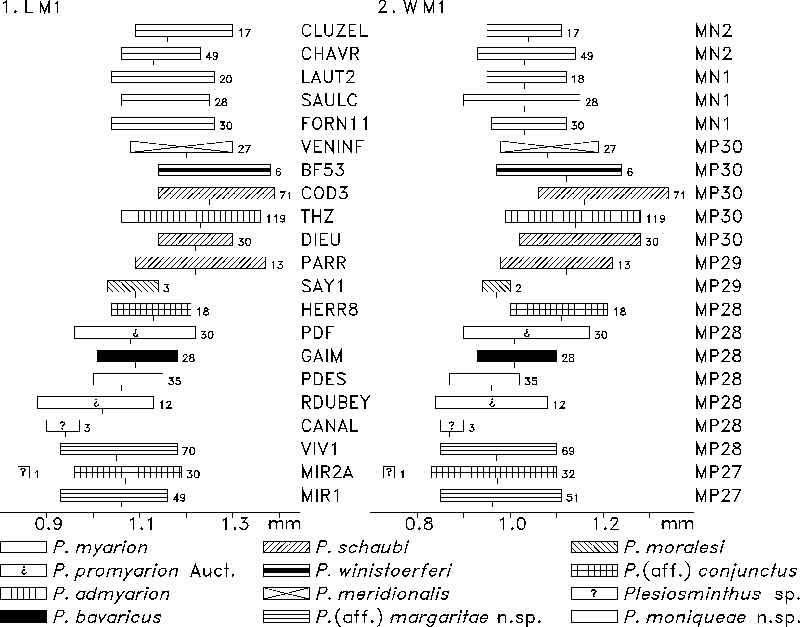
FIGURE 11. M2 length (1) and width (2) of Plesiosminthus species. The bars represent the minimum and maximum in mm, a tick marks the mean, and the number of specimens is given to the right.
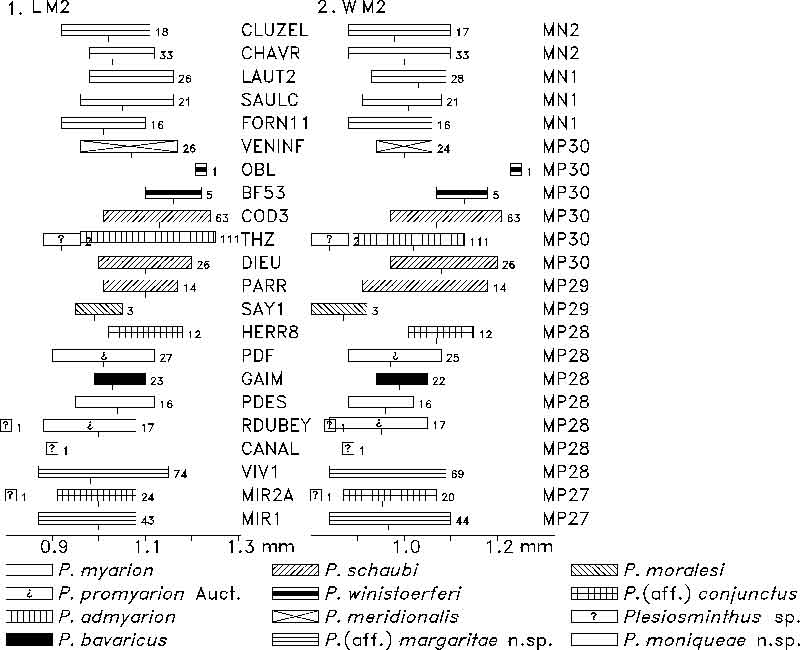
FIGURE 12. M3 length (1) and width (2) of Plesiosminthus species. The bars represent the minimum and maximum in mm, a tick marks the mean, and the number of specimens is given to the right.
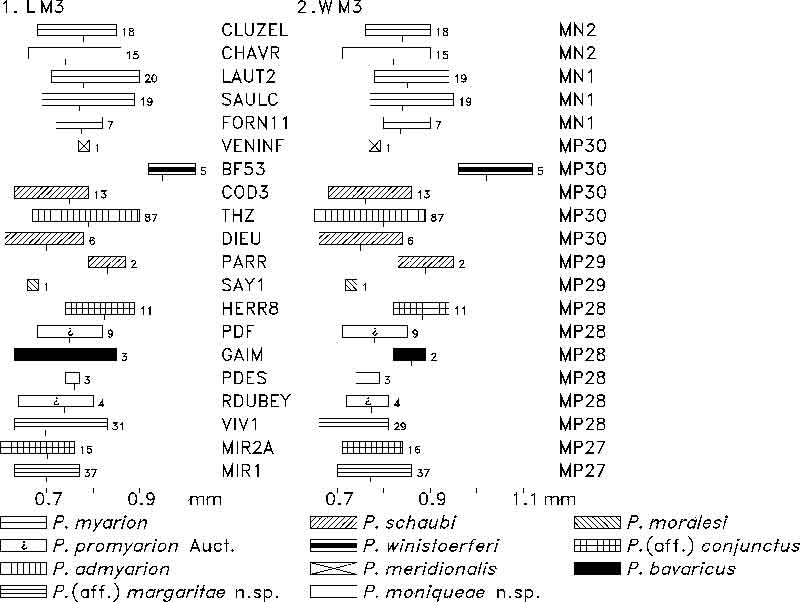
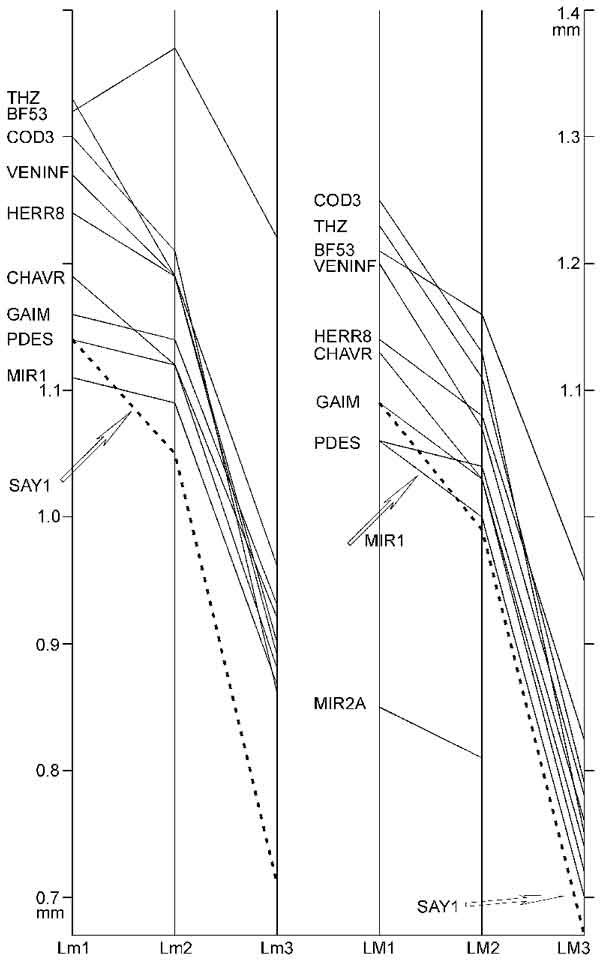
FIGURE 13. Relation of mean length values (in mm) of m1, m2, m3, M1, M2, M3 of Plesiosminthus species. Number of specimens per sample in Table 7.