

APPENDIX 1.
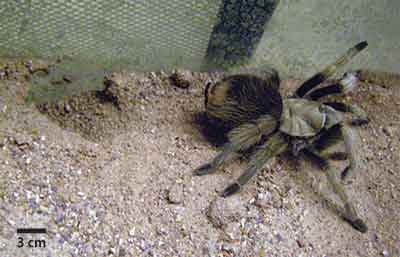
Video (click on image) of Aphonopelma chalcodes burrowing through excavation using its pedipalps.
APPENDIX 2.
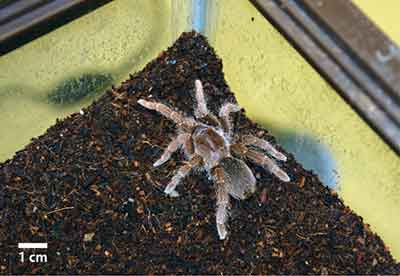
Video (click on image) of Pelinobius muticus burrowing through intrusion.
APPENDIX 3.
Mann-Whitney (MS) and Kolmogorov-Smirnov (KS) test results (p values) from the comparison of the properties of all burrows produced by Hysterocrates gigas, Pelinobius muticus, and Aphonopelma chalcodes. Yellow highlighted p values are considered significant ( p < 0.05). The mean, median, standard deviation, and range of each significantly different property is provided for each species. Highlighted values (blue and green) indicate the greater of the two.
| MW | KS | Hysterocrates gigas | Aphonopelma chalcodes | |||||||||
| Mean | Median | Std Dev | Range | Mean | Median | Std Dev | Range | |||||
| Surface openings | 1.000 | 1.000 | 1.0 | 1.0 | 0.0 | 1 | 1.0 | 1.0 | 0.0 | 1 | ||
| Maximum depth | 0.045 | 0.162 | 25.1 | 19.8 | 15.1 | 5.9 - 53.0 | 12.0 | 9.8 | 6.0 | 3.1 - 21.2 | ||
| Total length | 0.178 | 0.445 | 36.5 | 25.5 | 25.6 | 6.3 - 84.0 | 24.3 | 17.9 | 16.6 | 6.1 - 58.8 | ||
| Maximum width | 0.236 | 0.489 | 8.6 | 8.6 | 2.1 | 3.8 - 11.6 | 7.8 | 7.9 | 2.2 | 3.7 - 11.6 | ||
| Minimum width | 0.072 | 0.144 | 3.7 | 3.3 | 1.7 | 1.2 - 6.8 | 5.2 | 5.0 | 1.8 | 2.9 - 8.3 | ||
| Mean width | 0.191 | 0.162 | 5.9 | 5.9 | 1.3 | 3.5 - 8.4 | 6.6 | 6.6 | 1.4 | 3.4 - 7.9 | ||
| Maximum height | 0.347 | 0.375 | 7.1 | 7.4 | 1.4 | 4.2 - 8,7 | 6.3 | 6.7 | 1.6 | 2.4 - 8.2 | ||
| Minimum height | 0.540 | 0.489 | 3.2 | 3.1 | 1.1 | 1.4 - 5.3 | 3.2 | 2.5 | 2.1 | 1.2 - 8.2 | ||
| Mean height | 0.902 | 0.995 | 5.1 | 4.9 | 1.0 | 3.3 - 6.6 | 4.9 | 5.1 | 1.5 | 1.9 - 7.0 | ||
| Average W/H ratio | 0.835 | 0.489 | 1.2 | 1.1 | 0.2 | 1.0 - 1.7 | 1.2 | 1.2 | 0.4 | 0.5 - 1.8 | ||
| Maximum circumference | 0.022 | 0.012 | 25.0 | 24.8 | 4.7 | 13.0 - 31.0 | 19.3 | 22.3 | 7.6 | 2.7 - 25.4 | ||
| Minimum circumference | 0.307 | 0.759 | 12.7 | 11.8 | 5.2 | 4.0 - 21.0 | 10.2 | 9.9 | 4.6 | 1.8 - 17.6 | ||
| Mean circumference | 0.487 | 0.375 | 18.5 | 18.6 | 3.3 | 12.2 - 23.2 | 16.0 | 18.7 | 6.2 | 2.2 - 21.7 | ||
| Maximum slope | 0.002 | 0.003 | 89.0 | 90.0 | 3.2 | 80 - 90 | 57.2 | 55.0 | 24.7 | 25 - 90 | ||
| Minimum slope | 0.215 | 0.341 | 42.5 | 40.0 | 36.2 | 0 - 90 | 22.6 | 21.0 | 18.6 | 0 - 60 | ||
| Mean slope | 0.002 | 0.003 | 72.3 | 80.0 | 16.9 | 46 - 90 | 37.3 | 28.0 | 17.1 | 25 - 77 | ||
| Complexity | 0.006 | 0.038 | 3.8 | 4.0 | 1.1 | 2 - 4 | 2.4 | 2.0 | 0.5 | 2 - 3 | ||
| Tortuosity | 0.120 | 0.051 | 1.24 | 1.21 | 0.19 | 1.00 - 1.56 | 1.28 | 1.04 | 0.53 | 0.98 - 2.50 | ||
| MW
|
KS
|
Hysterocrates gigas | Pelinobius muticus | |||||||||
| Mean | Median | Std Dev | Range | Mean | Median | Std Dev | Range | |||||
| Surface openings | 1.000 | 1.000 | 1.0 | 1.0 | 0.0 | 1 | 1.0 | 1.0 | 0.0 | 1 | ||
| Maximum depth | 0.068 | 0.047 | 25.1 | 19.8 | 15.1 | 5.9 - 53.0 | 36.7 | 36.0 | 6.9 | 27.0 - 48.5 | ||
| Total length | 0.056 | 0.012 | 36.5 | 25.5 | 25.6 | 6.3 - 84.0 | 56.9 | 56.5 | 12.2 | 42.0 - 73.0 | ||
| Maximum width | 0.005 | 0.001 | 8.6 | 8.6 | 2.1 | 3.8 - 11.6 | 4.8 | 4.7 | 0.8 | 4.1 - 6.5 | ||
| Minimum width | 0.050 | 0.149 | 3.7 | 3.3 | 1.7 | 1.2 - 6.8 | 2.4 | 2.4 | 0.4 | 1.8 - 3.2 | ||
| Mean width | 0.002 | 0.004 | 5.9 | 5.9 | 1.3 | 3.5 - 8.4 | 3.4 | 3.2 | 0.9 | 2.6 - 5.6 | ||
| Maximum height | 0.033 | 0.025 | 7.1 | 7.4 | 1.4 | 4.2 - 8,7 | 4.9 | 4.5 | 1.8 | 2.7 - 8.8 | ||
| Minimum height | 0.036 | 0.064 | 3.2 | 3.1 | 1.1 | 1.4 - 5.3 | 2.2 | 2.2 | 0.5 | 1.6 - 2.9 | ||
| Mean height | 0.005 | 0.004 | 5.1 | 4.9 | 1.0 | 3.3 - 6.6 | 3.4 | 2.9 | 1.0 | 2.2 - 5.4 | ||
| Average W/H ratio | 0.259 | 0.738 | 1.2 | 1.1 | 0.2 | 1.0 - 1.7 | 1.0 | 1.1 | 0.2 | 0.7 - 1.2 | ||
| Maximum circumference | 0.003 | 0.001 | 25.0 | 24.8 | 4.7 | 13.0 - 31.0 | 15.2 | 14.1 | 2.7 | 12.5 - 20.5 | ||
| Minimum circumference | 0.021 | 0.047 | 12.7 | 11.8 | 5.2 | 4.0 - 21.0 | 8.0 | 7.3 | 1.6 | 6.5 - 10.5 | ||
| Mean circumference | 0.001 | 0.001 | 18.5 | 18.6 | 3.3 | 12.2 - 23.2 | 11.0 | 10.5 | 2.4 | 8.3 - 16.5 | ||
| Maximum slope | 0.935 | 0.985 | 89.0 | 90.0 | 3.2 | 80 - 90 | 88.8 | 90.0 | 3.5 | 80 - 90 | ||
| Minimum slope | 0.032 | 0.012 | 42.5 | 40.0 | 36.2 | 0 - 90 | 5.0 | 0.0 | 7.6 | 0 - 20 | ||
| Mean slope | 0.117 | 0.149 | 72.3 | 80.0 | 16.9 | 46 - 90 | 59.2 | 57.5 | 10.3 | 48 - 80 | ||
| Complexity | 0.487 | 0.827 | 3.8 | 4.0 | 1.1 | 2 - 4 | 4.4 | 4.0 | 1.4 | 3 - 6 | ||
| Tortuosity | 0.168 | 0.305 | 1.24 | 1.21 | 0.19 | 1.00 - 1.56 | 1.44 | 1.46 | 0.33 | 1.07 - 2.06 | ||
| MW
|
KS
|
Aphonopelma chalcodes | Pelinobius muticus | |||||||||
| Mean | Median | Std Dev | Range | Mean | Median | Std Dev | Range | |||||
| Surface openings | 1.000 | 1.000 | 1.0 | 1.0 | 0.0 | 1 | 1.0 | 1.0 | 0.0 | 1 | ||
| Maximum depth | 0.001 | 0.001 | 12.0 | 9.8 | 6.0 | 3.1 - 21.2 | 36.7 | 36.0 | 6.9 | 27.0 - 48.5 | ||
| Total length | 0.002 | 0.001 | 24.3 | 17.9 | 16.6 | 6.1 - 58.8 | 56.9 | 56.5 | 12.2 | 42.0 - 73.0 | ||
| Maximum width | 0.011 | 0.005 | 7.8 | 7.9 | 2.2 | 3.7 - 11.6 | 4.8 | 4.7 | 0.8 | 4.1 - 6.5 | ||
| Minimum width | 0.001 | 0.001 | 5.2 | 5.0 | 1.8 | 2.9 - 8.3 | 2.4 | 2.4 | 0.4 | 1.8 - 3.2 | ||
| Mean width | 0.001 | 0.001 | 6.6 | 6.6 | 1.4 | 3.4 - 7.9 | 3.4 | 3.2 | 0.9 | 2.6 - 5.6 | ||
| Maximum height | 0.083 | 0.034 | 6.3 | 6.7 | 1.6 | 2.4 - 8.2 | 4.9 | 4.5 | 1.8 | 2.7 - 8.8 | ||
| Minimum height | 0.335 | 0.638 | 3.2 | 2.5 | 2.1 | 1.2 - 8.2 | 2.2 | 2.2 | 0.5 | 1.6 - 2.9 | ||
| Mean height | 0.048 | 0.029 | 4.9 | 5.1 | 1.5 | 1.9 - 7.0 | 3.4 | 2.9 | 1.0 | 2.2 - 5.4 | ||
| Average W/H ratio | 0.331 | 0.279 | 1.2 | 1.2 | 0.4 | 0.5 - 1.8 | 1.0 | 1.1 | 0.2 | 0.7 - 1.2 | ||
| Maximum circumference | 0.075 | 0.024 | 19.3 | 22.3 | 7.6 | 2.7 - 25.4 | 15.2 | 14.1 | 2.7 | 12.5 - 20.5 | ||
| Minimum circumference | 0.135 | 0.279 | 10.2 | 9.9 | 4.6 | 1.8 - 17.6 | 8.0 | 7.3 | 1.6 | 6.5 - 10.5 | ||
| Mean circumference | 0.043 | 0.005 | 16.0 | 18.7 | 6.2 | 2.2 - 21.7 | 11.0 | 10.5 | 2.4 | 8.3 - 16.5 | ||
| Maximum slope | 0.006 | 0.005 | 57.2 | 55.0 | 24.7 | 25 - 90 | 88.8 | 90.0 | 3.5 | 80 - 90 | ||
| Minimum slope | 0.025 | 0.029 | 22.6 | 21.0 | 18.6 | 0 - 60 | 5.0 | 0.0 | 7.6 | 0 - 20 | ||
| Mean slope | 0.009 | 0.005 | 37.3 | 28.0 | 17.1 | 25 - 77 | 59.2 | 57.5 | 10.3 | 48 - 80 | ||
| Complexity | 0.003 | 0.041 | 2.4 | 2.0 | 0.5 | 2 - 3 | 4.4 | 4.0 | 1.4 | 3 - 6 | ||
| Tortuosity | 0.048 | 0.005 | 1.28 | 1.04 | 0.53 | 0.98 - 2.50 | 1.44 | 1.46 | 0.33 | 1.07 - 2.06 | ||
APPENDIX 4.
Quantitative measurements of the burrows of comparative animals. All measurements in cm or degrees (slope only); W/H ratio, complexity, and tortuosity are unitless. GI# = Gorgyrella inermis burrow cast identification number; PI# = Pandinus imperator burrow cast identification number; MM# = Mabuya multifasciata burrow cast identification number; AT# = Ambystoma tigrinum burrow cast identification number.
| Gorgyrella inermis | ||||||||||||||||||
| ID | Openings | Depth | Length | Max Width | Min Width | Mean Width | Max Height | Min Height | Mean Height | W/H Ratio | Max Circ | Min Circ | Mean Circ | Max Slope | Min Slope | Mean Slope | Complexity | Tortuosity |
| GI1 | 1 | 7.2 | 7.8 | 2.1 | 1.6 | 1.9 | 1.9 | 1.5 | 1.7 | 1.1 | 6.3 | 5.7 | 6 | 85 | 85 | 85 | 2 | 1.1 |
| GI2 | 1 | 7.2 | 7.9 | 2.4 | 1.8 | 2.1 | 2.4 | 1.7 | 2.1 | 1 | 7.6 | 5.8 | 7 | 85 | 85 | 85 | 2 | 1.1 |
| GI3 | 1 | 9.8 | 10 | 2.5 | 1.8 | 2.2 | 2.5 | 1.7 | 2.1 | 1 | 7.8 | 5.1 | 6.7 | 85 | 85 | 85 | 2 | 1 |
| GI4 | 1 | 13.4 | 13.6 | 3.2 | 1.9 | 2.9 | 2.9 | 2.2 | 2.7 | 1.1 | 9.8 | 6.1 | 9 | 85 | 85 | 85 | 2 | 1 |
| GI5 | 1 | 14.2 | 14.6 | 2.3 | 1.8 | 2.1 | 1.7 | 2.4 | 2.1 | 1 | 7.5 | 5.7 | 7.1 | 90 | 85 | 87.5 | 2 | 1.1 |
| GI6 | 1 | 9.4 | 9.6 | 3 | 2.6 | 2.9 | 2.8 | 2.2 | 2.5 | 1.2 | 9.3 | 7.4 | 8.6 | 88 | 88 | 88 | 2 | 1 |
| GI7 | 1 | 16.3 | 18.4 | 2.4 | 1.9 | 2.1 | 2.7 | 1.7 | 2.1 | 1 | 7.9 | 5.4 | 6.6 | 90 | 78 | 84 | 3 | 1.4 |
| Pandinus imperator | ||||||||||||||||||
| ID | Openings | Depth | Length | Max Width | Min Width | Mean Width | Max Height | Min Height | Mean Height | W/H Ratio | Max Circ | Min Circ | Mean Circ | Max Slope | Min Slope | Mean Slope | Complexity | Tortuosity |
| PI1 | 1 | 6.5 | 28 | 7.6 | 6 | 6.7 | 4.4 | 2.9 | 3.7 | 1.8 | 23.5 | 17.5 | 19.3 | 20 | 15 | 17 | 3 | 1 |
| PI2 | 1 | 5 | 18 | 6.3 | 3.6 | 5.6 | 3.6 | 2.2 | 2.8 | 2 | 18 | 12 | 15.1 | 20 | 0 | 13 | 3 | 1.1 |
| PI3 | 1 | 13 | 34 | 11.6 | 3.9 | 8.2 | 4.2 | 1.9 | 2.9 | 2.8 | 28 | 10 | 19.7 | 50 | 0 | 19.3 | 3 | 1.1 |
| PI4 | 1 | 6 | 29 | 7.1 | 3.8 | 6.3 | 3.8 | 1.7 | 2.9 | 2.2 | 19.5 | 12 | 17 | 20 | 0 | 6.7 | 3 | 1 |
| PI5 | 1 | 7 | 19.5 | 6.3 | 4.8 | 5.8 | 2.7 | 1.8 | 2.5 | 2.3 | 16 | 13 | 15.2 | 20 | 0 | 13 | 2 | 1 |
| PI6 | 1 | 12.5 | 34 | 12 | 7.4 | 9.6 | 7.1 | 3 | 3.9 | 2.5 | 28.5 | 20.5 | 24.8 | 30 | 0 | 14 | 3 | 1.7 |
| PI7 | 1 | 16 | 34 | 11.3 | 5.5 | 8.7 | 5.4 | 3.9 | 4.5 | 1.9 | 27.1 | 12.2 | 21.5 | 30 | 0 | 24 | 3 | 1.1 |
| PI8 | 1 | 14 | 29 | 6.4 | 4.3 | 5.5 | 3.4 | 2.1 | 2.7 | 2 | 16 | 11 | 14.1 | 50 | 0 | 21 | 3 | 1.1 |
| PI9 | 1 | 15 | 32 | 8.3 | 4.2 | 6.5 | 5.9 | 2 | 4.5 | 1.4 | 22.5 | 12.5 | 19 | 30 | 0 | 18 | 3 | 1.5 |
| Mabuya multifasciata | ||||||||||||||||||
| ID | Openings | Depth | Length | Max Width | Min Width | Mean Width | Max Height | Min Height | Mean Height | W/H Ratio | Max Circ | Min Circ | Mean Circ | Max Slope | Min Slope | Mean Slope | Complexity | Tortuosity |
| MM1 | 1 | 2.3 | 6.5 | 2.2 | 1.9 | 2 | 2 | 1.3 | 1.6 | 1.3 | 7.4 | 6.8 | 7.2 | 51 | 4 | 28 | 2 | 1.0 |
| MM2 | 1 | 5.4 | 28.7 | 5.3 | 2.2 | 4 | 3 | 1.9 | 2.5 | 1.6 | 13.9 | 7 | 11.9 | 32 | 6 | 19 | 2 | 1.2 |
| MM3 | 1 | 5.3 | 19.6 | 5.1 | 1.9 | 3.3 | 2.6 | 1.5 | 2.1 | 1.6 | 12.5 | 6.5 | 9.3 | 42 | 5 | 24 | 3 | 1.1 |
| MM4 | 1 | 2.8 | 11 | 3.5 | 2.4 | 2.8 | 2.7 | 1.6 | 2 | 1.4 | 9.7 | 7.2 | 8.4 | 55 | 28 | 42 | 2 | 1.2 |
| MM5 | 1 | 4.8 | 11 | 2.5 | 2.1 | 2.3 | 5.6 | 2.4 | 3.6 | 0.7 | 14.2 | 8.1 | 10.8 | 30 | 7 | 19 | 2 | 1.2 |
| MM6 | 1 | 5 | 14.5 | 2.6 | 1.9 | 2.3 | 2.4 | 1.4 | 1.8 | 1.3 | 8.2 | 6.1 | 6.9 | 45 | 10 | 28 | 2 | 1.2 |
| MM7 | 1 | 3.8 | 10.8 | 4.5 | 2.2 | 3.1 | 2.9 | 1.4 | 2.4 | 1.3 | 11.8 | 5.5 | 8.5 | 48 | 3 | 26 | 2 | 1.0 |
| MM8 | 1 | 9.4 | 11.6 | 4.3 | 2 | 2.8 | 3.4 | 1.5 | 2.2 | 1.2 | 14.2 | 6.4 | 9.6 | 62 | 35 | 49 | 2 | 1.2 |
| Ambystoma tigrinum | ||||||||||||||||||
| ID | Openings | Depth | Length | Max Width | Min Width | Mean Width | Max Height | Min Height | Mean Height | W/H Ratio | Max Circ | Min Circ | Mean Circ | Max Slope | Min Slope | Mean Slope | Complexity | Tortuosity |
| AT1 | 1 | 5.8 | 9.8 | 3.3 | 1.2 | 2.1 | 2.2 | 1.1 | 1.5 | 1.4 | 13 | 4.5 | 9.8 | 35 | 35 | 35 | 2 | 1.5 |
| AT2 | 1 | 9.3 | 19.5 | 5 | 1.6 | 3.5 | 3.1 | 1.6 | 2.4 | 1.5 | 11.3 | 6.1 | 9.3 | 67 | 67 | 67 | 2 | 1.3 |
| AT3 | 1 | 4 | 11.3 | 4.1 | 1.9 | 3.2 | 2.8 | 1.6 | 2.1 | 1.5 | 11.1 | 6.1 | 8.3 | 31 | 31 | 31 | 2 | 1.3 |
| AT4 | 1 | 7.5 | 9 | 2.1 | 0.9 | 1.7 | 1.7 | 1.1 | 1.5 | 1.1 | 7.2 | 4.3 | 6 | 64 | 64 | 64 | 2 | 1.2 |
| AT5 | 1 | 9.8 | 13 | 4.5 | 2.9 | 3.8 | 3.4 | 2.6 | 2.8 | 1.4 | 11.6 | 9.3 | 10.5 | 53 | 53 | 53 | 2 | 1.1 |
| AT6 | 1 | 12.4 | 15.5 | 3.5 | 2.4 | 2.9 | 2.5 | 1.3 | 1.9 | 1.5 | 9 | 6.4 | 7.6 | 65 | 65 | 65 | 2 | 1 |
| AT7 | 1 | 8.7 | 12.5 | 3.6 | 2.3 | 3 | 3.2 | 1.5 | 2.2 | 1.4 | 10.6 | 6.9 | 8.2 | 62 | 62 | 62 | 2 | 1.3 |
| AT8 | 1 | 5.2 | 10 | 3 | 2.1 | 2.7 | 2 | 1.5 | 1.8 | 1.5 | 8.4 | 6.2 | 7.3 | 40 | 40 | 40 | 2 | 1.6 |
| AT9 | 1 | 4.2 | 11.3 | 2.5 | 2 | 2.2 | 2.6 | 1.6 | 2 | 1.1 | 8.6 | 5.8 | 7.5 | 40 | 40 | 40 | 2 | 1.3 |
