FIGURE 1. 1, Phylogeny of spiders; tarantulas belong to the Mygalomorphae, a basal group of the Opisthothelae. 2, Geographic range of tarantulas. The shaded areas of the map represent known areas containing extant species of tarantulas. 3, Spider morphology.
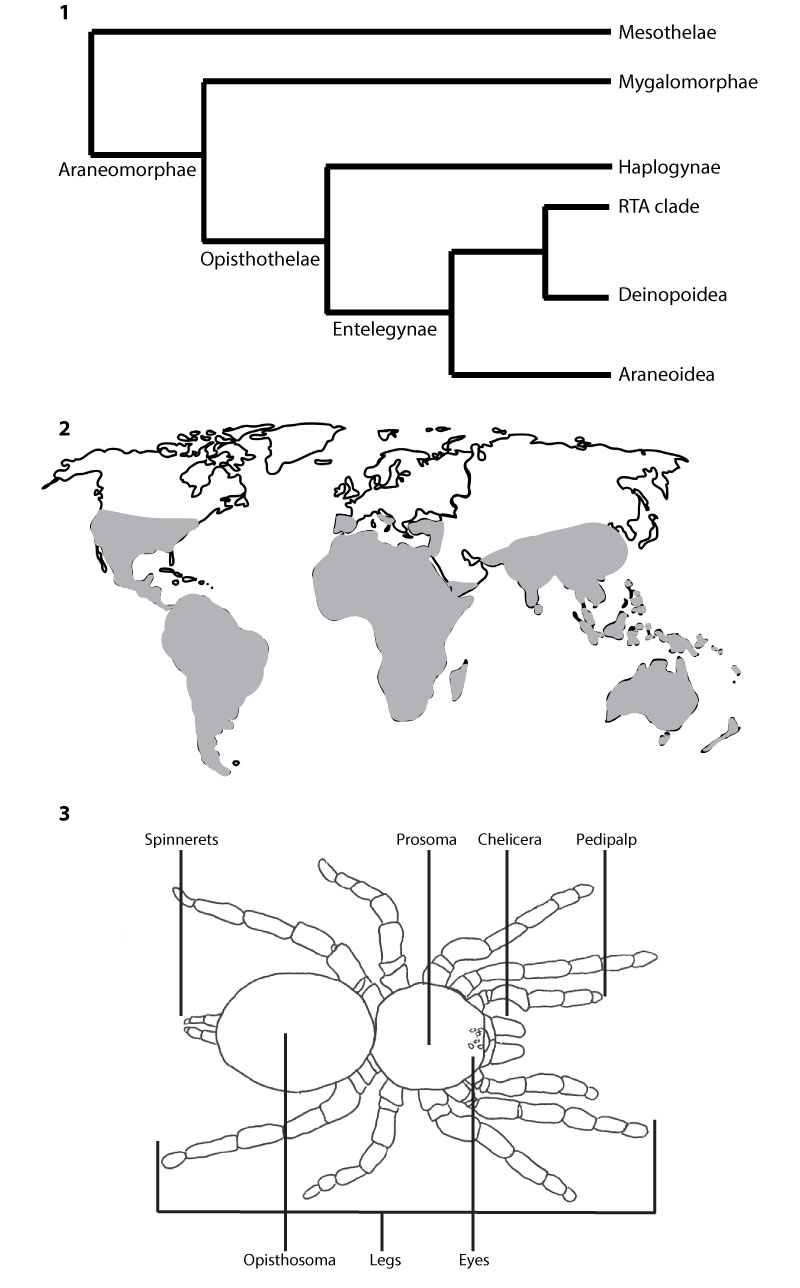
FIGURE 2. Tarantula specimens. 1, Hysterocrates gigas. 2, Pelinobius muticus. 3, Aphonopelma chalcodes.
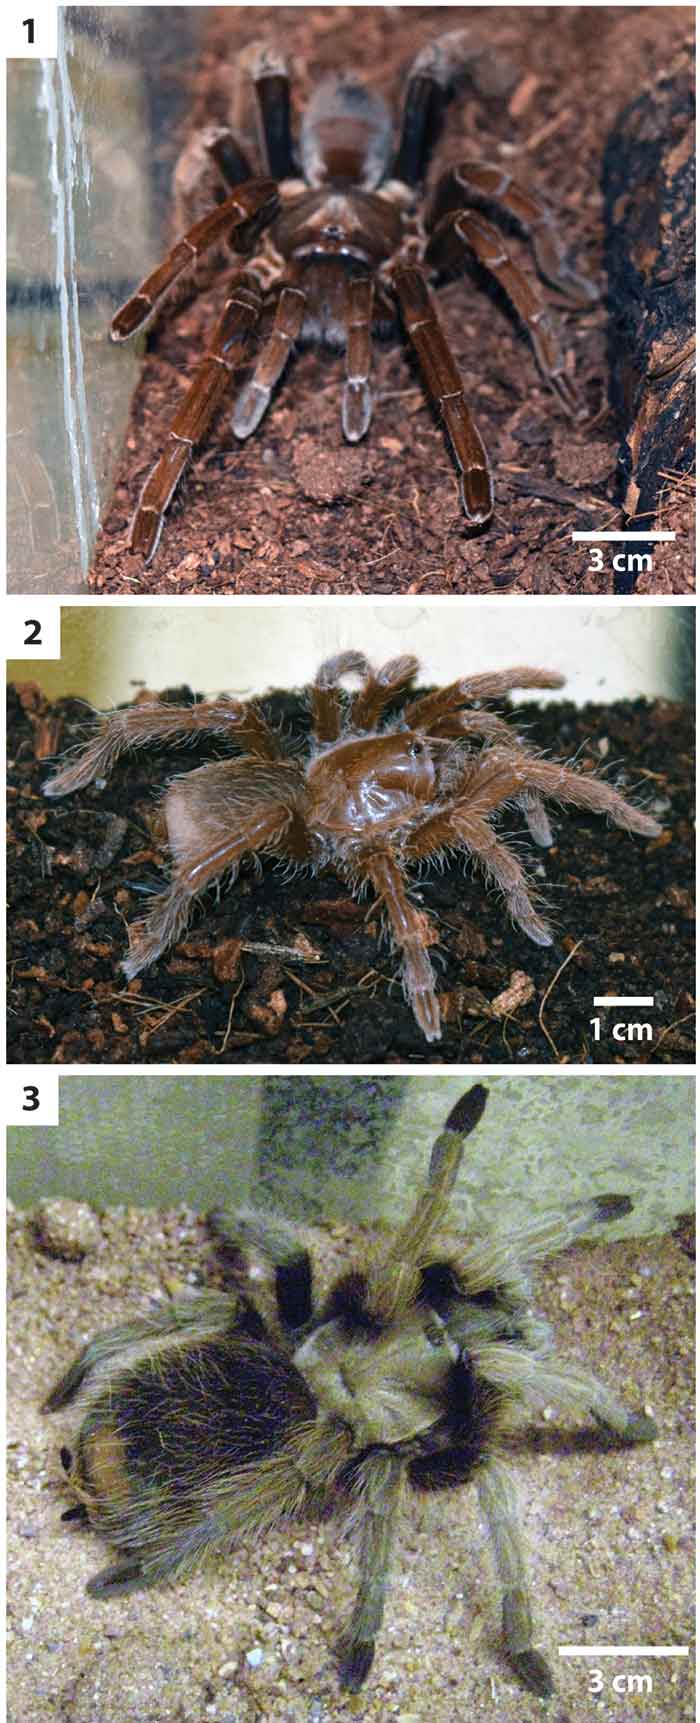
FIGURE 3. Examples of sediment-filled terraria. 1, Surface of terrarium surface of for Hysterocrates gigas. 2, Surface of terrarium substrate for Aphonopelma chalcodes. 3, Side view of a 246 L terrarium housing H. gigas.
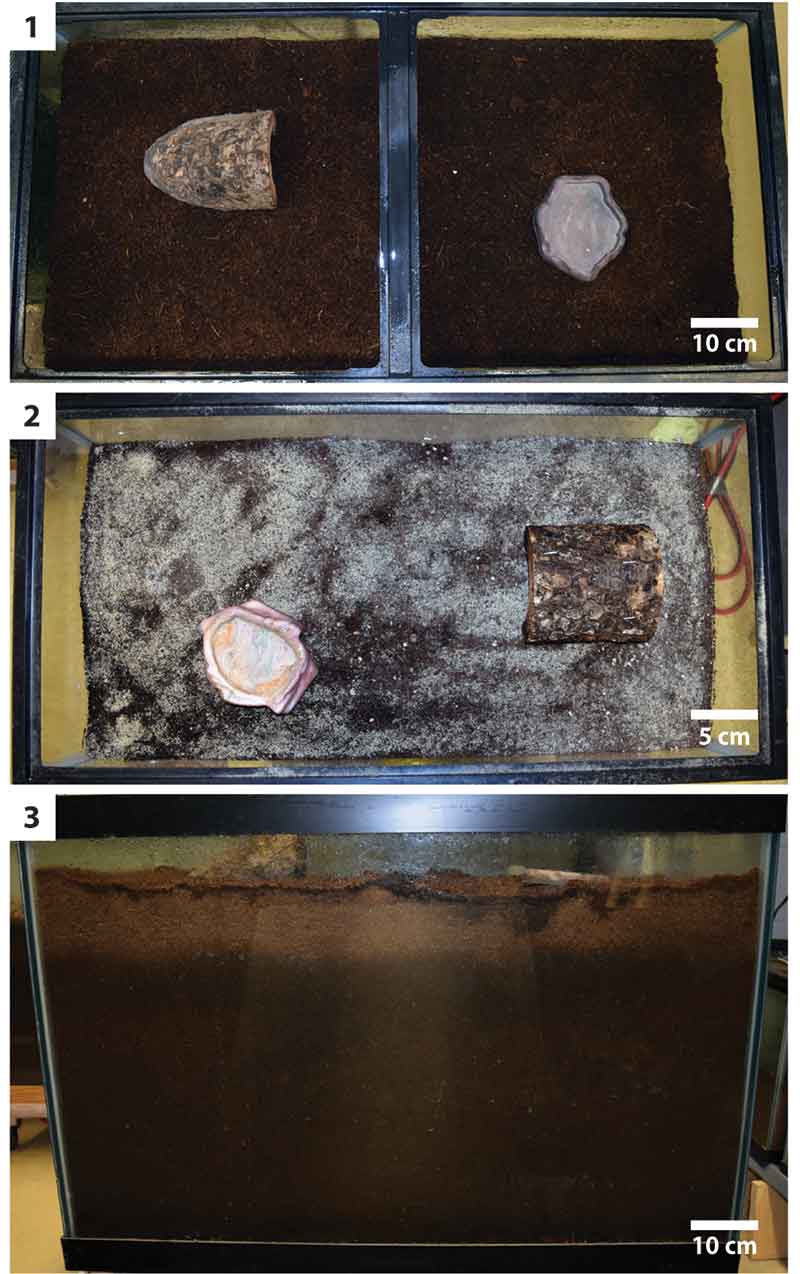
FIGURE 4. Quantitative burrow property diagram. 1, Burrows were described by their slope (S), maximum depth (D), tunnel, shaft, and chamber width (w), height (h), and circumference (c), total length (L), and branching angle (BA). 2, Complexity is the sum of the number of segments (s), chambers (h), and surface openings (e) within a single burrow system. 3, Tortuosity is the average sinuosity of the segments within a burrow system. The tortuosity of a single segment is found by dividing the total length (u) by the straight line distance (v). Modified from Hils and Hembree (2015).
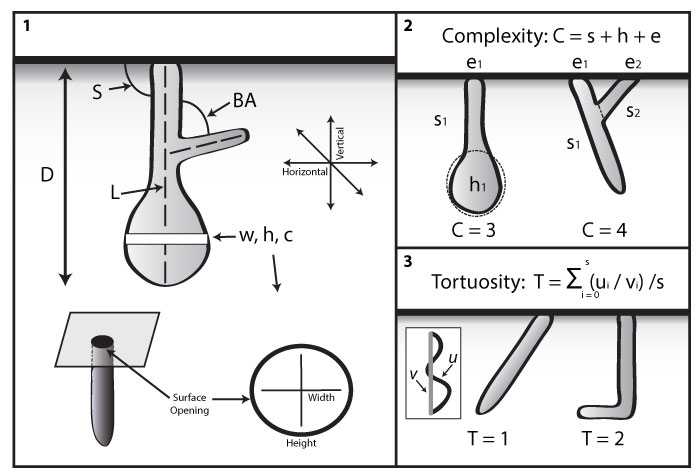
FIGURE 5. Comparative trace-making animals and casts of their typical burrow morphologies. 1-2, Gorgyrella sp. (trapdoor spider). 3-4, Pandinus imperator (scorpion). 5-6, Ambystoma tigrinum (salamander). 7-8, Mabuya multifasciata (skink).
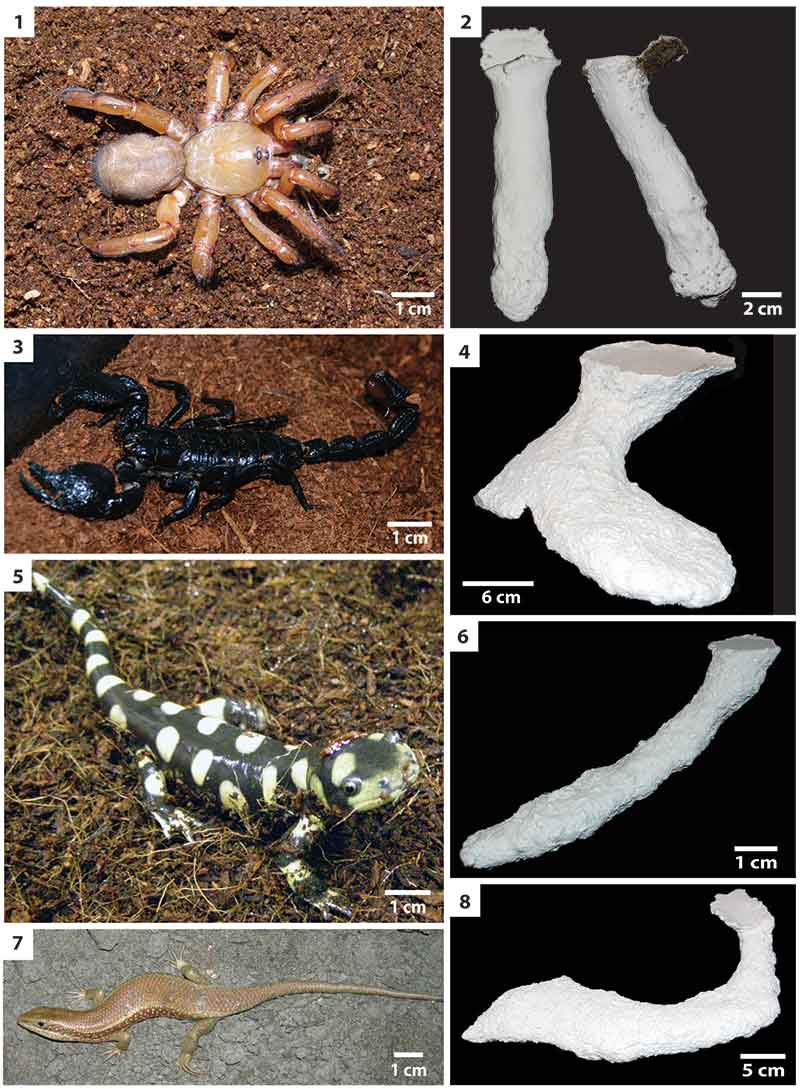
FIGURE 6. 1, Specimen of Hysterocrates gigas initiating burrow construction. 2, Continued excavation of H. gigas burrow; sediment from burrow is deposited on the surface behind the burrow opening. 3, Specimen of Pelinobius muticus transporting excavated sediment with its pedipalps up the burrow shaft. 4, Specimen of P. muticus packing excavating sediment into the base of the sediment mound at the top of the burrow shaft. 5, Specimen of H. gigas in its burrow chamber. 6, Specimen of P. muticus in burrow shaft below the burrow opening.
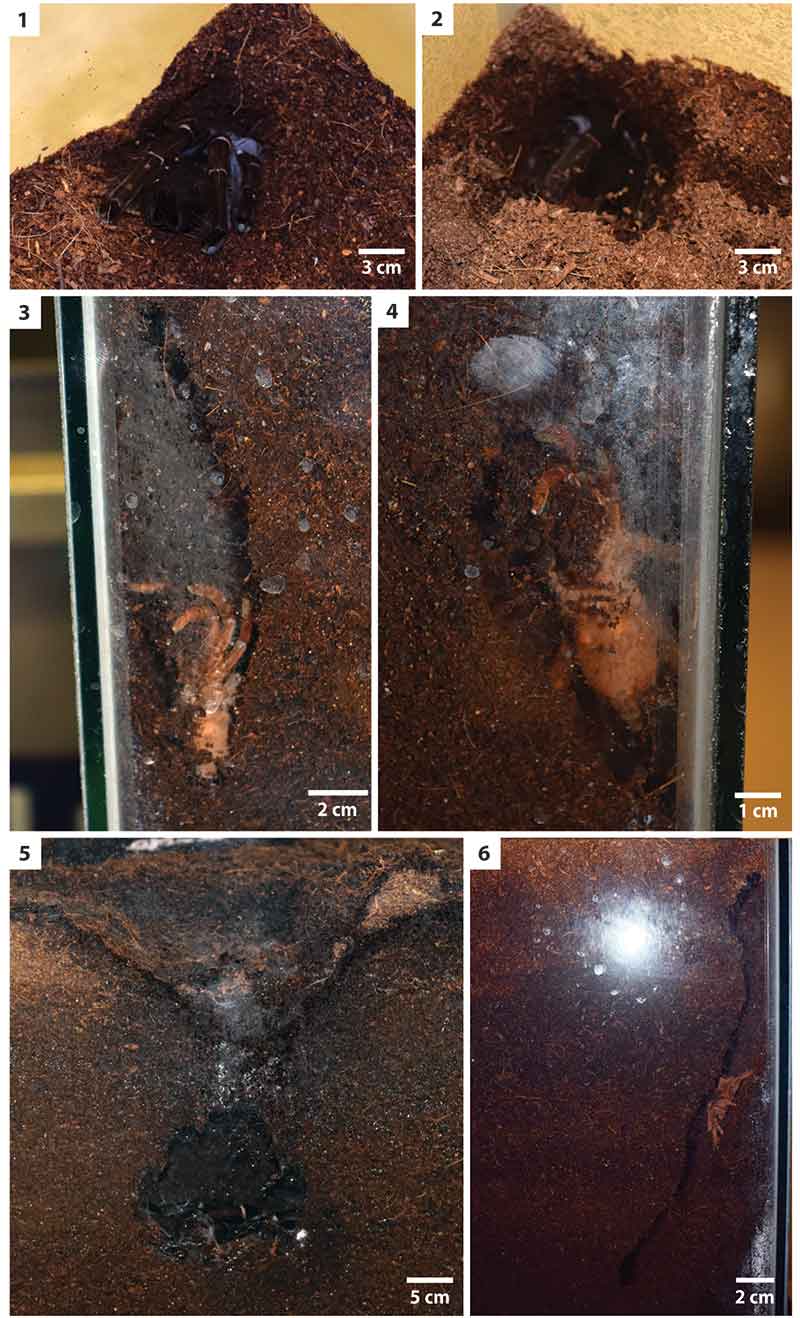
FIGURE 7. 1, Low mound of excavated sediment produced by Pelinobius muticus ; circular opening is present in the center. 2, Large mound of excavated sediment produced by Hysterocrates gigas with a circular opening in the center of the mound. 3, Extensive spoil pile of excavated sediment extending from the opening of a H. gigas burrow. 4, Side view of an Aphonopelma chalcodes terrarium showing extensive, irregular surface topography produced by burrow excavation as well as the exposed cross section of a helical burrow (at arrow).
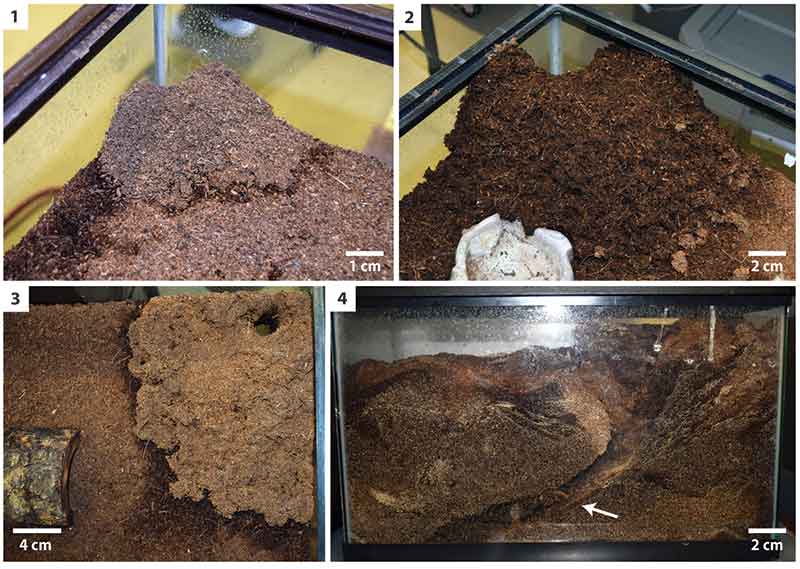
FIGURE 8. Hysterocrates gigas burrow casts. 1, Side view of vertical burrow with expanded terminal chamber (HG4). 2, Side view of vertical burrow with expanded terminal chamber and a short lower shaft (HG2). 3, Side view of a vertical burrow with and expanded upper chamber and an elongate lower shaft. 4, Side view of a sinuous vertical burrow with an upper and terminal expanded chambers (HG8). 5, Side view of a vertical to horizontal burrow with upper and lower expanded chambers (HG9). 6, Top view of a vertical to horizontal burrow with upper and lower expanded chambers (HG7).
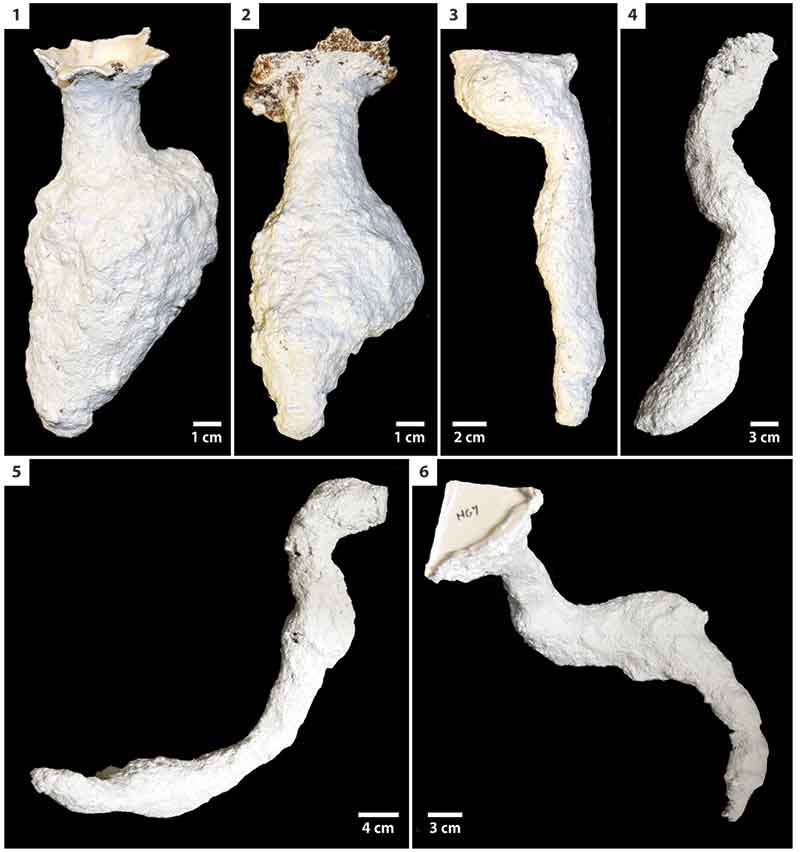
FIGURE 9. Pelinobius muticus burrow casts. 1-3, Side views of vertical, sinuous burrows with a laterally expanded terminal chamber (PM6, PM1, PM3, respectively). 4-5, Oblique and side views of a large diameter, vertical sinuous burrow ending with a horizontal tunnel (PM5). 6-7, Side and top views of a vertical burrow terminating in a horizontal tunnel (PM4). The burrow ends with two bifurcating tunnels. 8, Vertical, branching burrow (PM2). 9-10, Oblique and side view of a vertical, sinuous burrow with two branching tunnels (PM7).
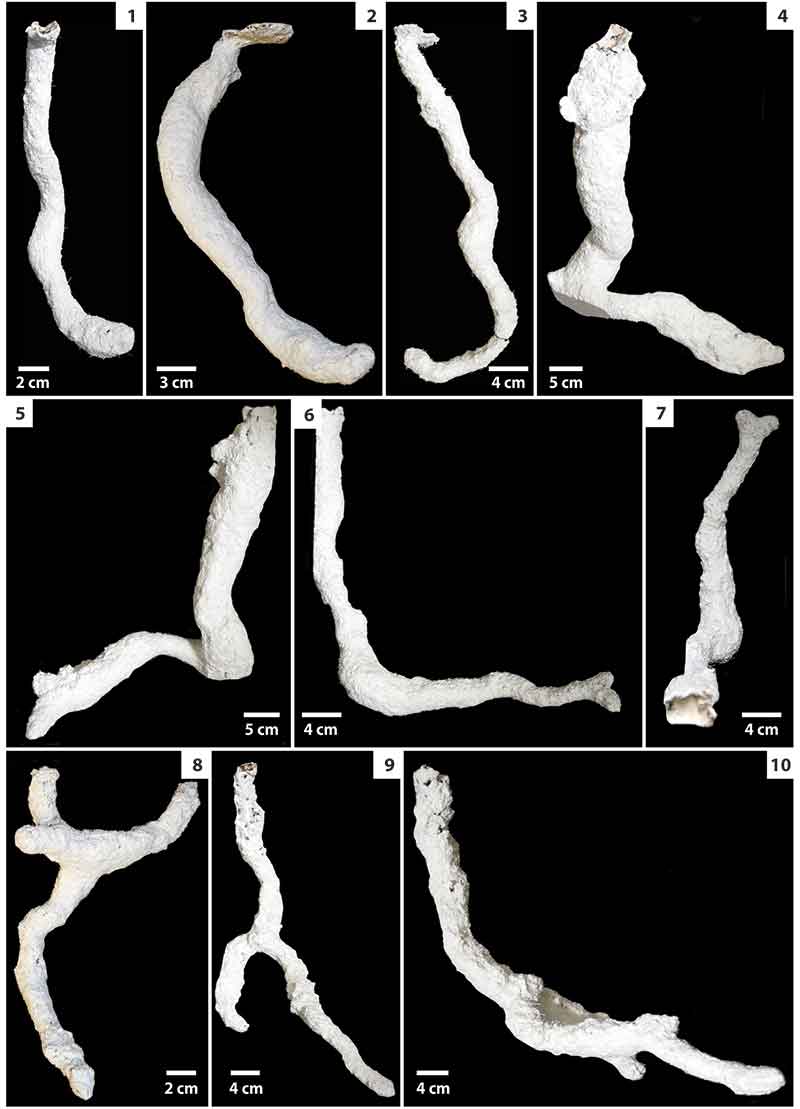
FIGURE 10. Aphonopelma chalcodes burrow casts. 1, Side view of a subvertical tunnel with a series of parallel ridges along the tunnel wall (at arrow) (AC3). 2, Side view of a subvertical tunnel with a vertical entrance shaft and a laterally expanded terminal chamber (AC7). 3, Top view of a subvertical tunnel (AC1). 4-5, Side and top views of a subvertical tunnel with a changing slope along its length (AC8). 6-7, Oblique and side views of a helical burrow with a series of parallel ridges along the tunnel wall (at arrow) and a laterally expanded terminal chamber (AC6).
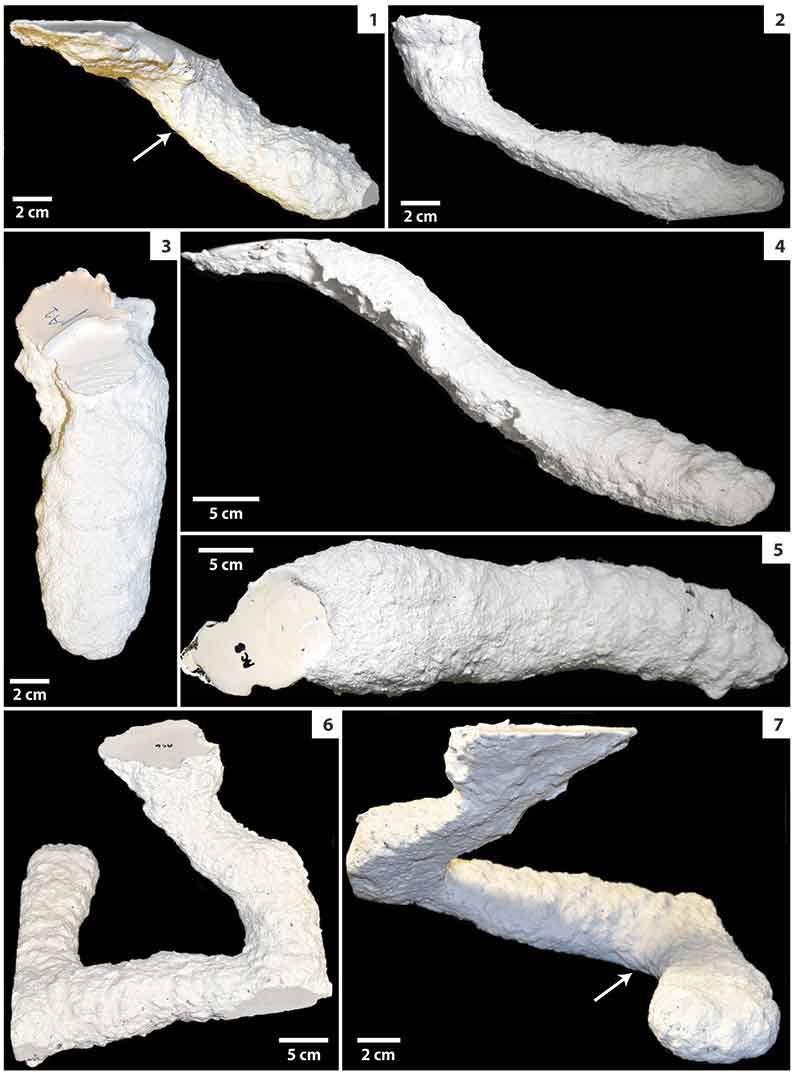
FIGURE 11. Cluster analysis of burrows produced by Hysterocrates gigas (HG, blue, n = 10), Pelinobius muticus (PM, green, n = 8), and Aphonopelma chalcodes (AC, red, n = 9). Burrows sort into four moderately to highly similar (BC > 0.7) clusters by trace maker and architecture (A-D). Cluster A consists entirely of burrows of A. chalcodes ; Cluster B consists of five burrows of H. gigas (83%) and a single burrow of A. chalcodes (17%); Cluster C consists of eight burrows of P. muticus (73%) and three burrows of H. gigas (27%); Cluster D consists of two burrows each of H. gigas (50%) and P. muticus (50%). Values located at the labeled nodes of the dendrogram are the mean Bray-Curtis similarity score of all burrows emanating from that node cluster.
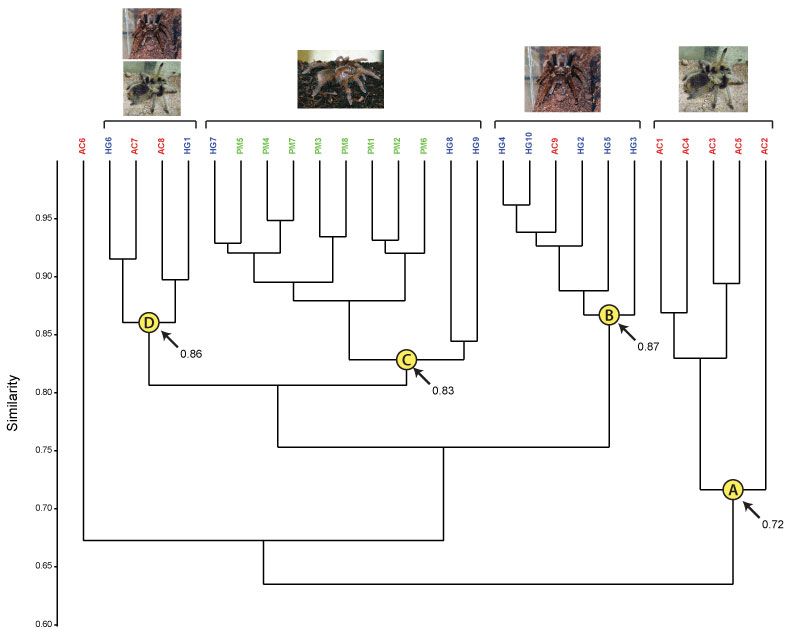
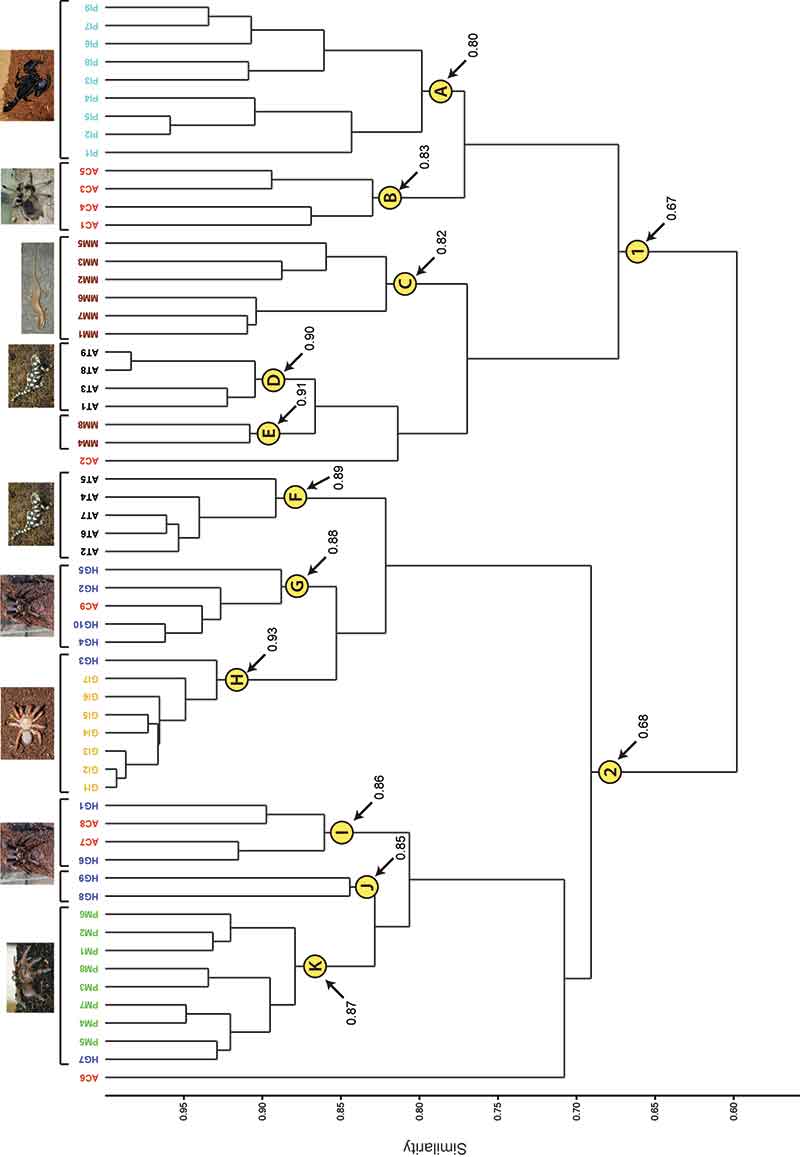
FIGURE 12. All animal burrow cluster diagram. Cluster analysis of the burrows produced by Hysterocrates gigas (HG, blue, n = 10), Pelinobius muticus (PM, green, n = 8), and Aphonopelma chalcodes (AC, red, n = 9), the scorpion Pandinus imperator (PI, light blue, n = 9), trapdoor spider Gorgyrella inermis (GI, yellow, n = 7) (yellow), the salamander Ambystoma tigrinum (AT, black, n = 9) (red), and the skink Mabuya multifasciata (MM, purple, n = 8) (green). The burrows sort into 11 highly similar (BC > 0.80) clusters (A-K), each populated primarily by the burrows of a single trace maker: A = 100% P. imperator (n = 9); B = 100% A. chalcodes (n = 4); C = 100% M. multifasciata (n = 6); D = 100% A. tigrinum (n = 4); E = 100% M. multifasciata (n = 2); F = 100% A. tigrinum (n = 5); G = 80% H. gigas (n = 4); H = 88% G. inermis (n = 7); I = 50% H. gigas/A. chalcodes (n = 2 each); J = 100% H. gigas (n = 2); K = 89% P. muticus (n = 8).