FIGURE 1. Different protocols used in this study. 1, Upper and lower tooth rows of Ovis aries. The red circled numbers 1-7 refer to the facets used in each protocol and are labelled on the maxillary and mandibular tooth rows (1, disto-labial protoconid facet of the first lower molar; 2, disto-labial protoconid facet of the second lower molar; 3, disto-labial protoconid facet of the third lower molar; 4, mesio-lingual paracone paracone facet of the first upper molar; 5, mesio-lingual paracone facet of the second upper molar; 6, mesio-lingual paracone facet of the third upper molar; 7, mesio-lingual protocone facet of the second upper molar). 2, Differences in scan size: The influence of scan size on the microwear signal is tested by comparing scans of different sizes (illustrated) but from the same central position of the disto-labial protoconid facet (red square). The three squares along the disto-labial protoconid facet indicate the positions used for the 3-spot median. 3, Differences between facets: The homogeneity of the microwear signal between upper and lower molars is tested by comparing lower molars to two different upper molar facets. Red dots highlight the facets which were scanned. Arrows lead to the color-view of the corresponding scan. 4, Differences along the tooth row: the homogeneity of the microwear signal between cheek teeth is tested by comparing first, second and third lowers molars of the same tooth row. Red dots highlight the facets which were scanned. Arrows lead to the color-view of the corresponding scan. 5, Simulation as a bridge between experimentation and fossil samples: Random draw from each 60-observation sample in order to simulate samples with isolated cheekteeth belonging to possibly the same individuals. A 10 observation simulated sample is given here as an example.
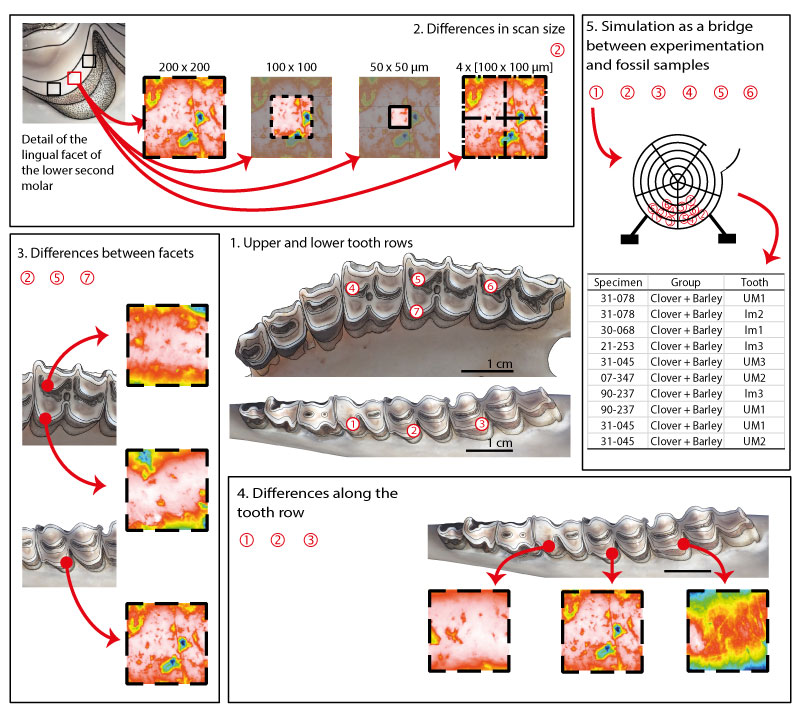
FIGURE 2. Mean and standard error of the mean for complexity (Asfc) and anisotropy (epLsar) of the dental microwear textures for each ewe sample and for different scan options. The four boxes are schematic representations of enamel surfaces with varying microwear textures (high/low epLsar and high/low Asfc).
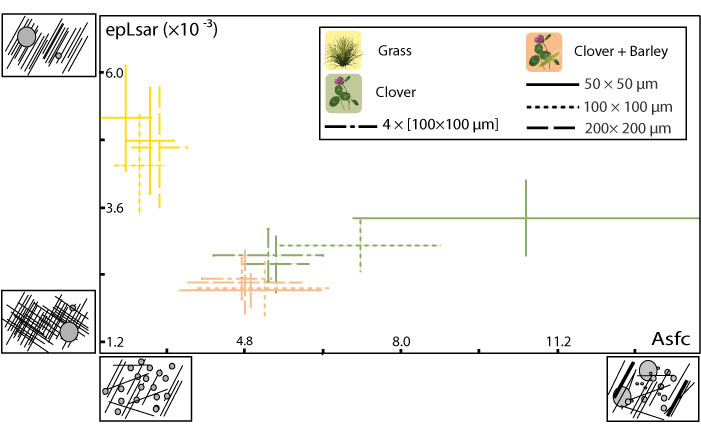
FIGURE 3. Mean and standard error of the mean for complexity (Asfc) and anisotropy (epLsar) of the dental microwear textures for dental facets from upper and lower molars and for each dietary sample. 1, Comparison of the disto-labial protoconid facet of the second lower molar and the mesio-lingual paracone facet of the second upper molar. 2, Comparison of the disto-labial protoconid facet of the second lower molar and lingual protocone facet of the second upper molar.
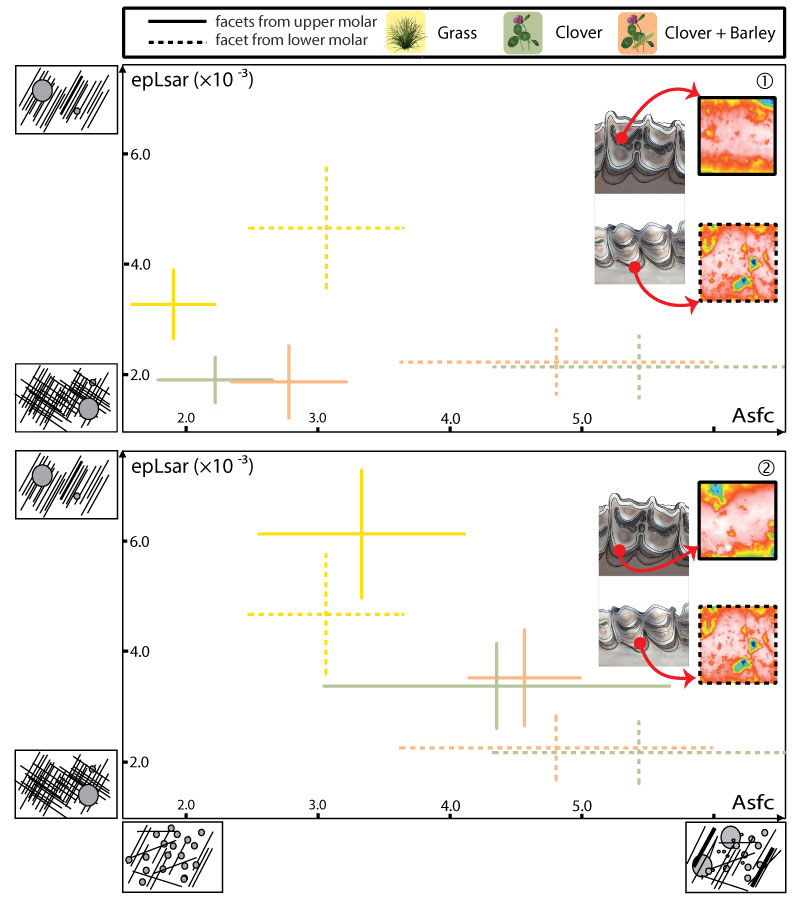
FIGURE 4. Mean and standard error of the mean for complexity (Asfc) and anisotropy (epLsar) of the dental microwear textures for each ewe sample and for each molar of the tooth row.
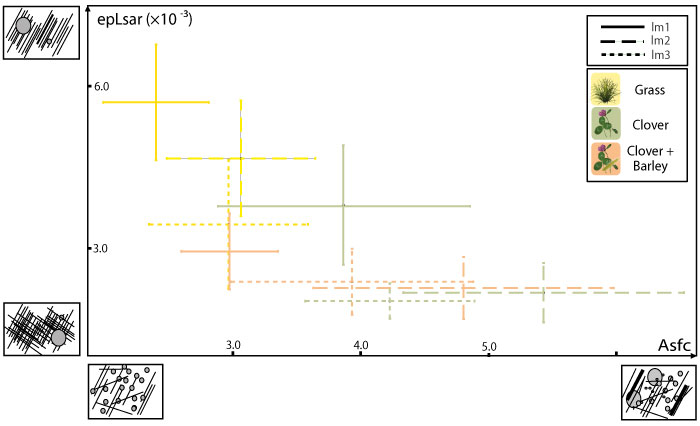
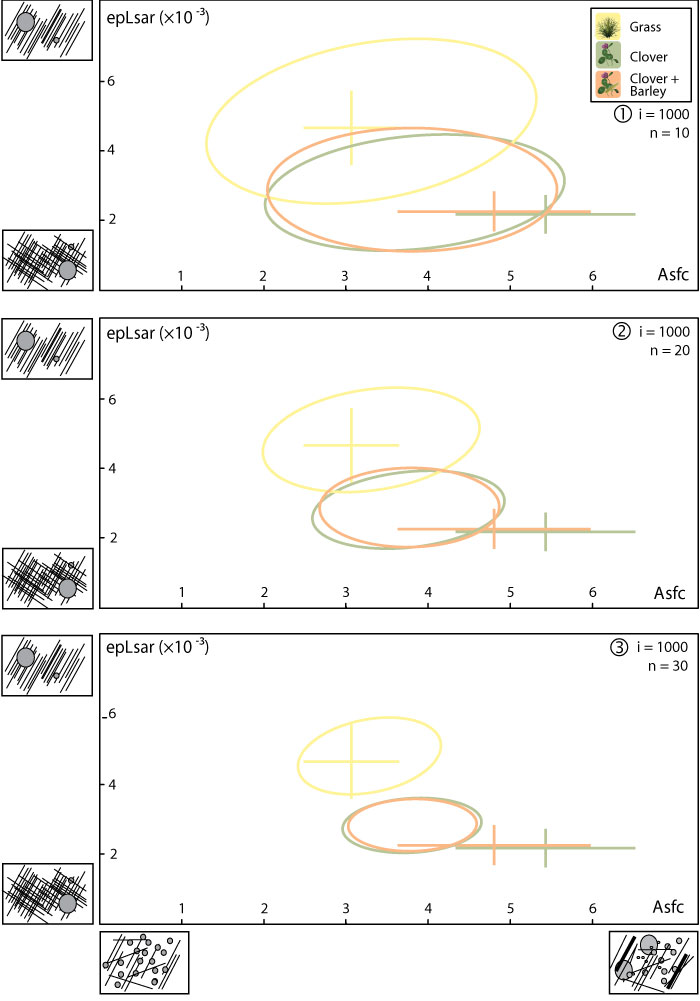
FIGURE 5. Mean and standard error of the mean for complexity (Asfc) and anisotropy (epLsar) of the dental microwear textures for the simulations of fossil data using random sampling of the ewe dataset. Ellipses represent 95% of the means for each iteration. Mean and standard error of the mean for each sample (lower second molars) are also represented for comparison. 1, Simulation with 10 individuals per dietary category and 1000 iterations. 2, Simulation with 20 individuals per dietary category and 1000 iterations. 3, Simulation with 30 individuals per dietary category and 1000 iterations.