FIGURE 1. Map with fossil sites which are currently included in the database. The numbers indicate the sites, as provided in the leftmost column in Table 1.
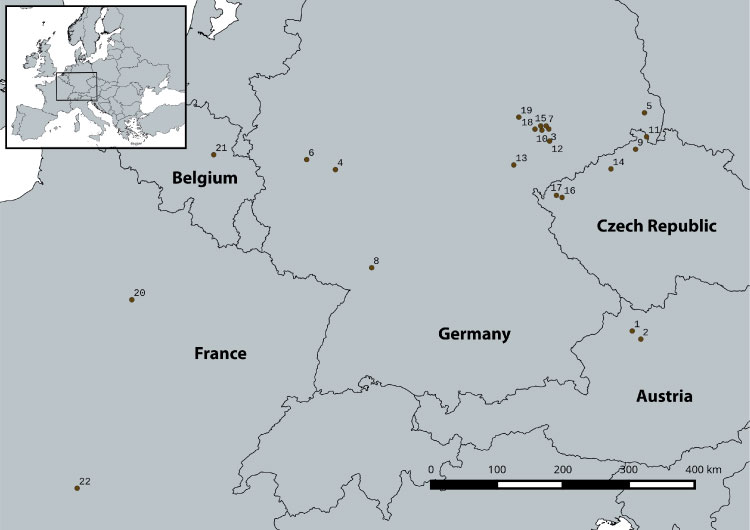
FIGURE 2. Example for the process of producing shapefiles from fossil leaf images. Green line: outline of original fossil. Red line: outline of replenished leaf. The red line partially covers the green line. Blue lines: petiole length and petiole width at the most apical point of the petiole. Yellow rectangle: bounding box encasing the specimen. Craspedodromophyllum betuloides Kvaček and Teodoridis, 2011 (NMP_G11231, Prague).
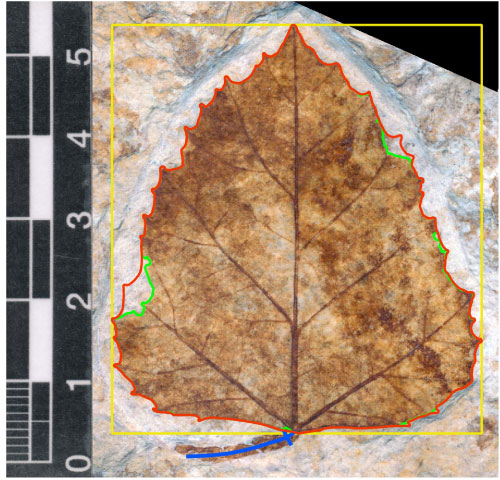
FIGURE 3. Frequency of toothed and untoothed leaf margins for the Paleocene, Eocene and Oligocene, obtained for 3214 specimens in MORPHYLL. Significance level (Pearson Chi-Square) < 0.001.
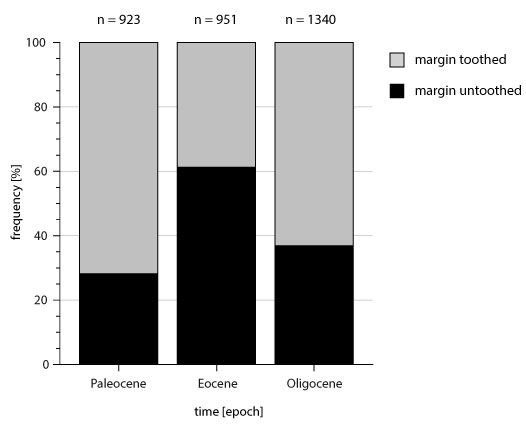
FIGURE 4. Data distribution of leaf lamina area (1), leaf circularity (2) and leaf mass per area (LMA) (3) for the Paleocene (blue graphs and box plots), Eocene (green graphs and box plots), Oligocene (red graphs and box plots) and all data (black graphs and box plots). The box plots span the 50 % interquartile. The lines within the boxes indicate the median values. The “whiskers” mark the highest and lowest values. Outliers are drawn as filled circles.
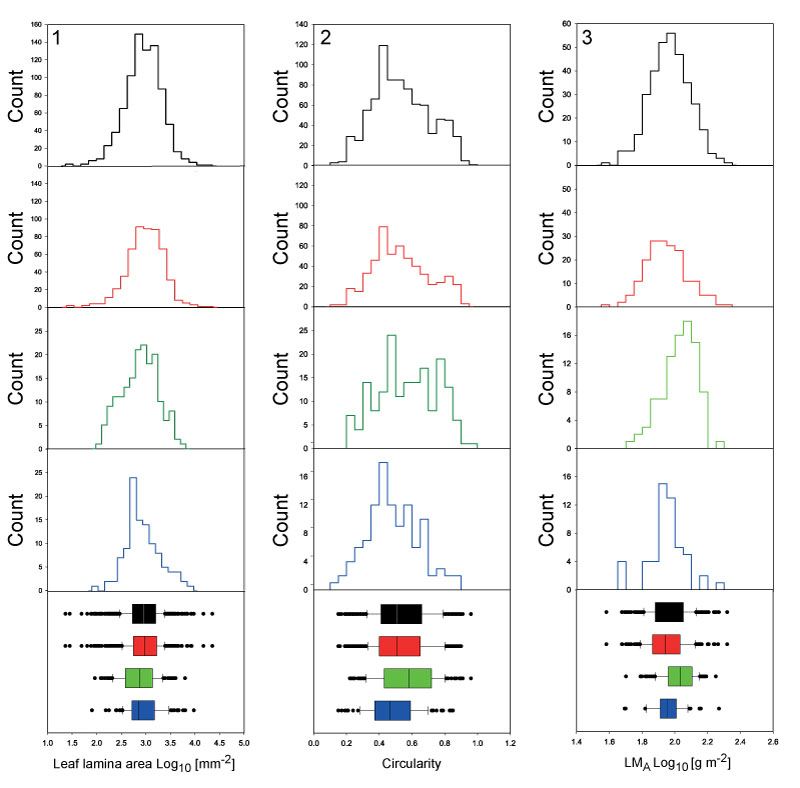
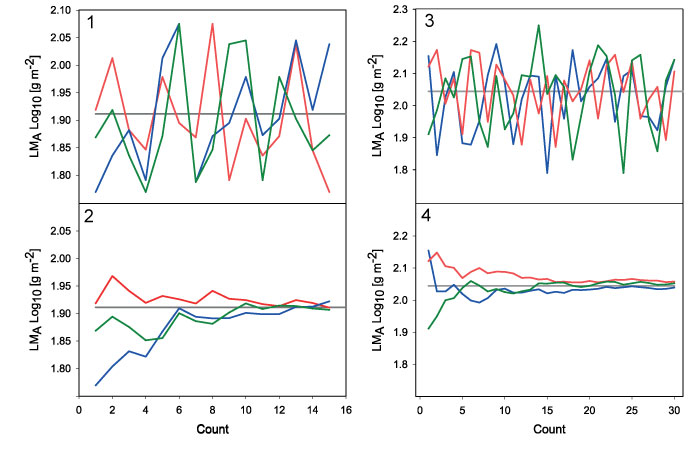
FIGURE 5. Random sampling analysis for LMA, for evaluation of the number of data required to arrive at a statistically stable signal. (1) Three independent rounds (blue, green and red) of drawing 15 random samples from specimens of one taxon (Platanus neptuni), site Rauenberg (Oligocene). The grey horizontal line represents the mean value for all specimens of P. neptuni from Rauenberg. The graphs show the LMA value of each random sample. (2) The course of the mean value of LMA , calculated after each drawing cycle. (3) Three independent rounds (blue, green and red) of drawing 30 random samples from all specimens from the site Kučlín (Eocene). The grey horizontal line represents the mean value for all specimens. The graphs show the LMA value of each random sample. (4) The course of the mean value of LMA, calculated after each drawing cycle.