FIGURE 1. Map of Australia showing the localities of all known Oligo-Miocene wombat specimens (indicated by triangles).
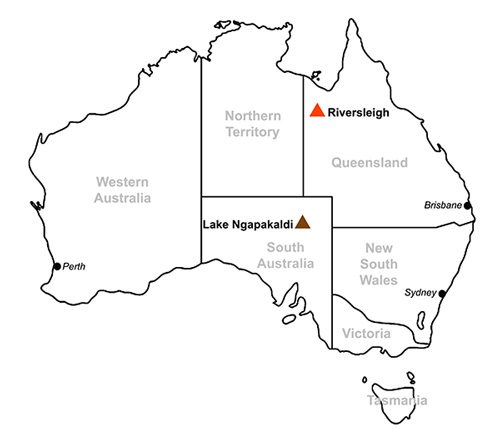
FIGURE 2. QM F20838, right I1 of Rhizophascolonus crowcrofti from Dirk’s Towers Site in dorsal, ventral, distal and mesial view (top row), and occlusal and basal view (bottom row). Scale bar represents 10 mm.
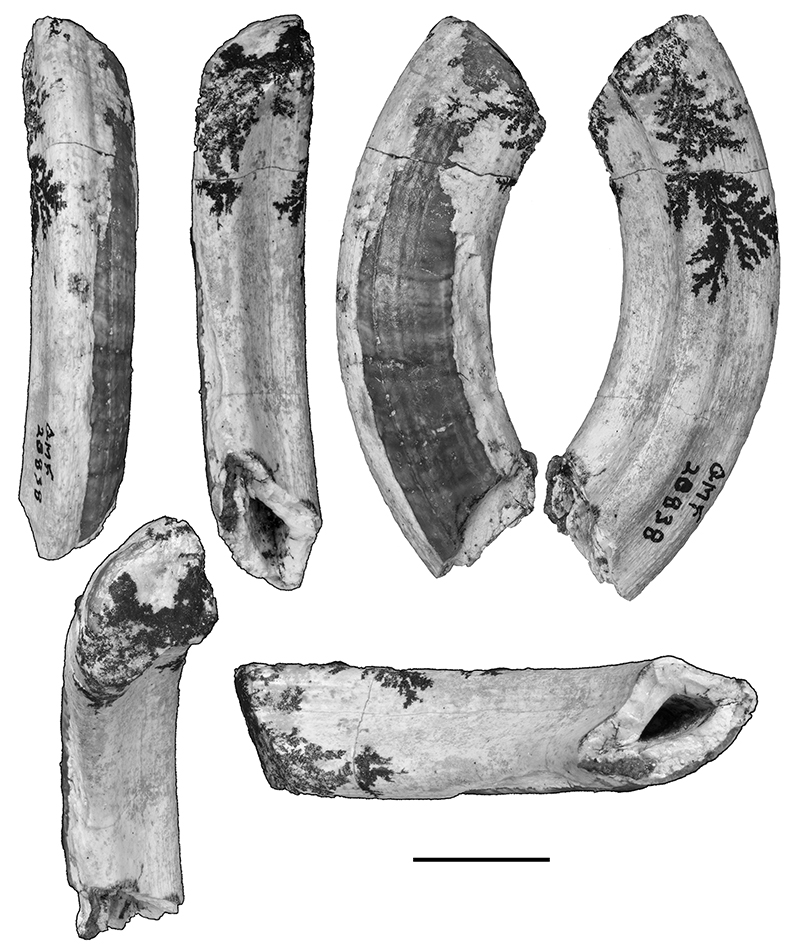
FIGURE 3. M1 of R. crowcrowfti in lingual, anterior, buccal, posterior, and occlusal view (left to right). 1. QM F30790, right M1 from Dirk’s Towers Site. 2. QM F23461, left M1 from Cleft of Ages Site. Scale bar represents 10 mm.
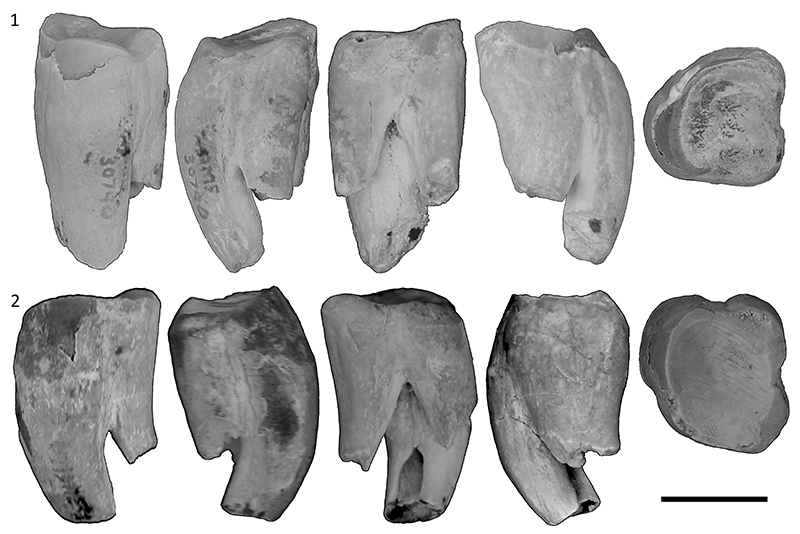
FIGURE 4. Upper molars of R. crowcrofti in lingual, anterior, buccal, posterior and occlusal view (left to right) from Cleft of Ages Site. 1. QM F20494, left M (probably M2). 2. QM F20708, right M (probably M2 or M3). 3. QM F23771, left M (probably M2 or M3). 4. QM F29656, left M (probably M3 or M4). Scale bar represents 10 mm.
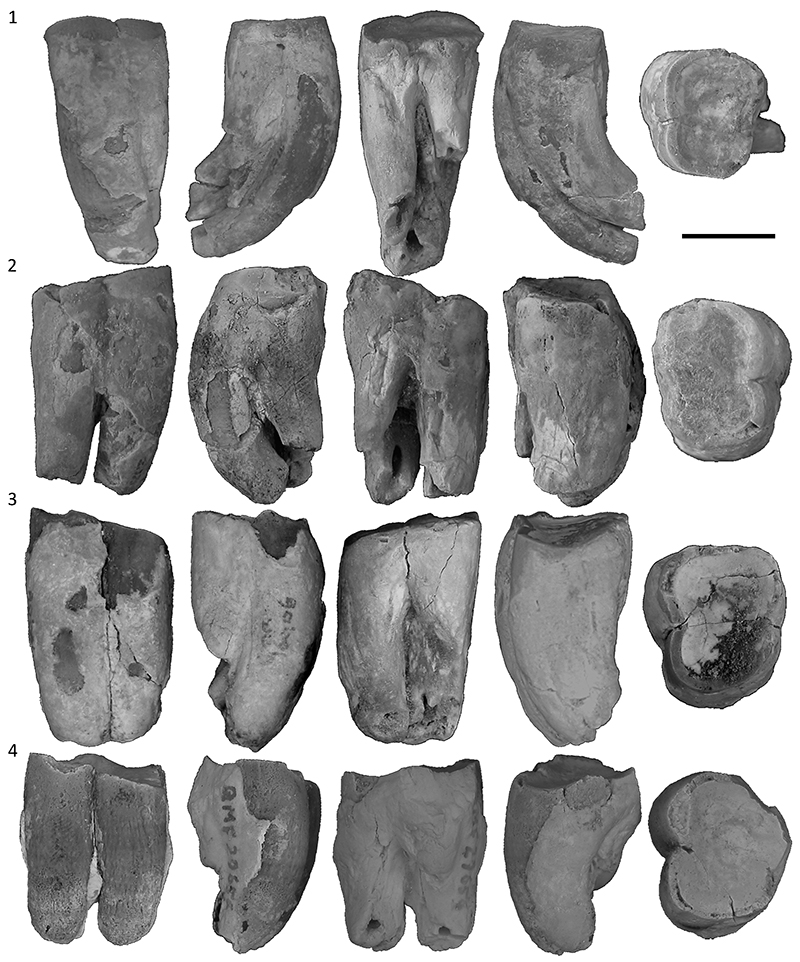
FIGURE 5. Upper molars of R. crowcrofti in lingual, anterior, buccal, posterior, and occlusal view (left to right). 1. QM F57959, left M (probably M2 or M3) from Cleft of Ages Site. 2. QM F57963, right M (probably M2) from Cleft of Ages Site. 3. QM F57958, right M (probably M2 or M3) from Wholly Dooley Site. Scale bar represents 10 mm.
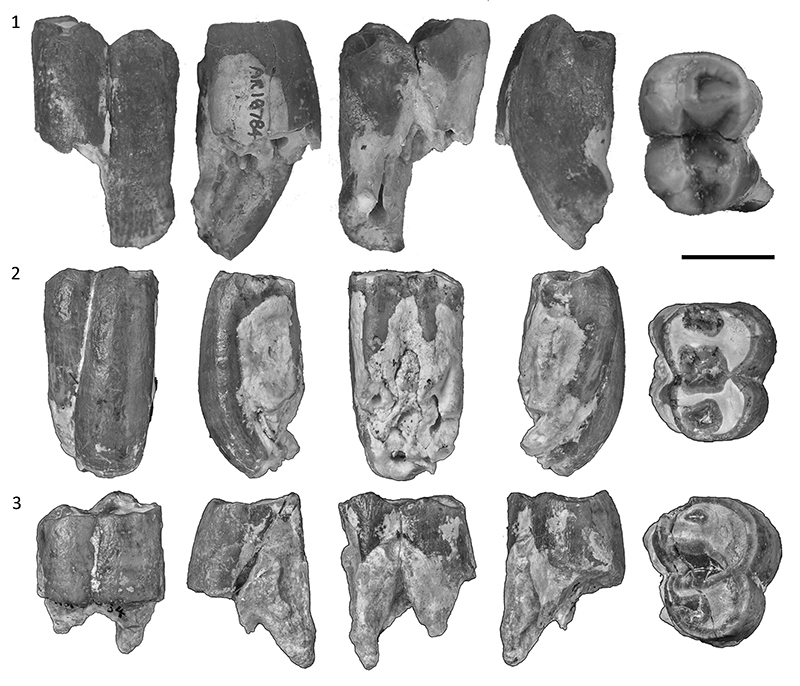
FIGURE 6. Lower molars of R. crowcrowfti in buccal, anterior, lingual, posterior, and occlusal view (left to right) from Cleft of Ages Site. 1. QM F57961, left m (probably m2 or m3). 2. QM F57962, right m (probably m2 or m3). 3. QM F57960, right m (probably m2 or m3). 4. QM F12452, right m (probably m3 or m4). Scale bar represents 10 mm.
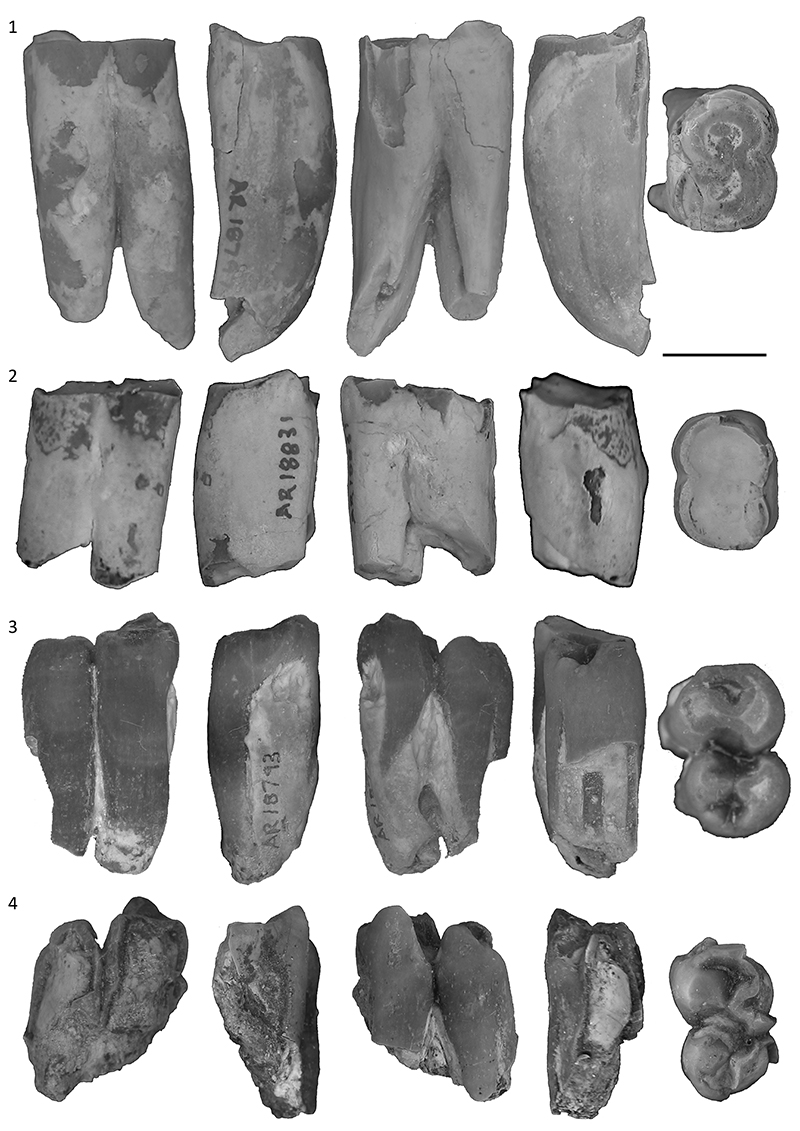
FIGURE 7. Bivariate plots showing relative width of anterior and posterior moieties of molars. The upper molars of Rhizophascolonus sp. are represented by QM F57964-5 and the lower molars by QM F20613.
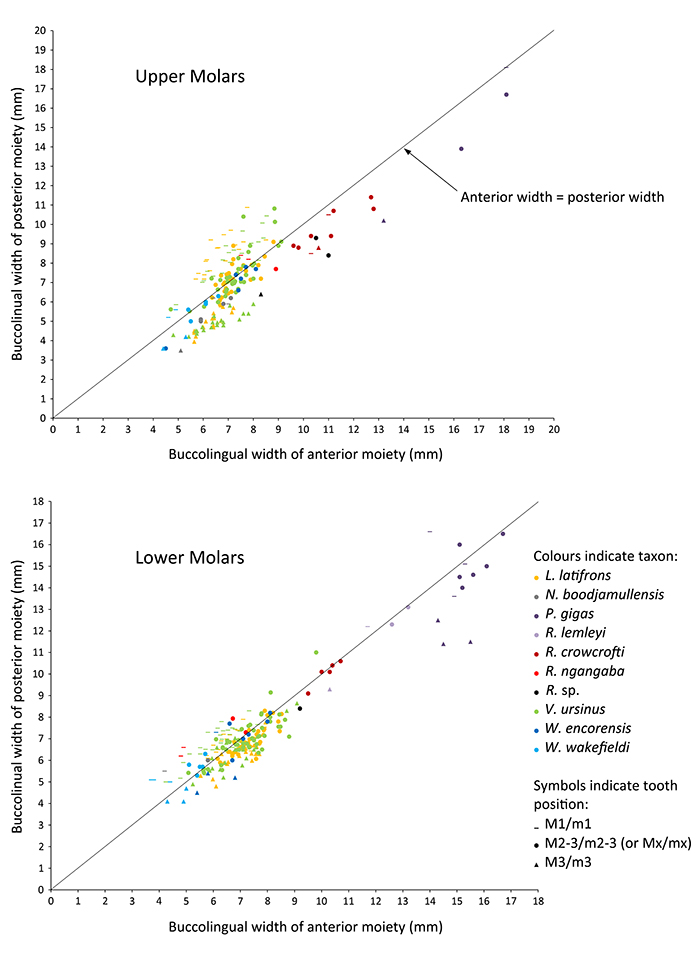
FIGURE 8. Box and whisker plot of anteroposterior length of molars of a range of wombat taxa and Phascolarctos cinereus. Number of specimens measured for each taxon is indicated above highest value for each taxon.
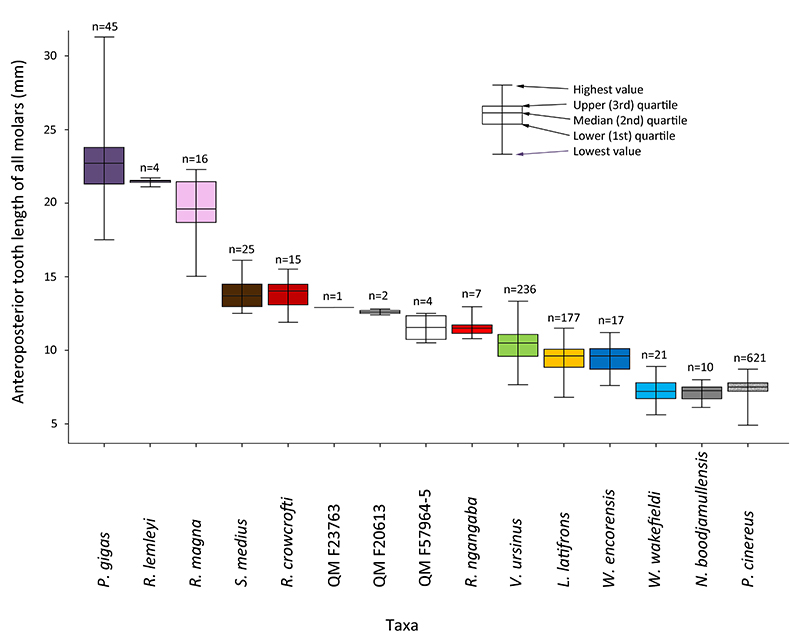
FIGURE 9. QM F23903, left P3 from Camel Sputum Site in lingual, anterior, and occlusal view (top row) and buccal and posterior view (bottom row). Scale bar represents 10 mm.
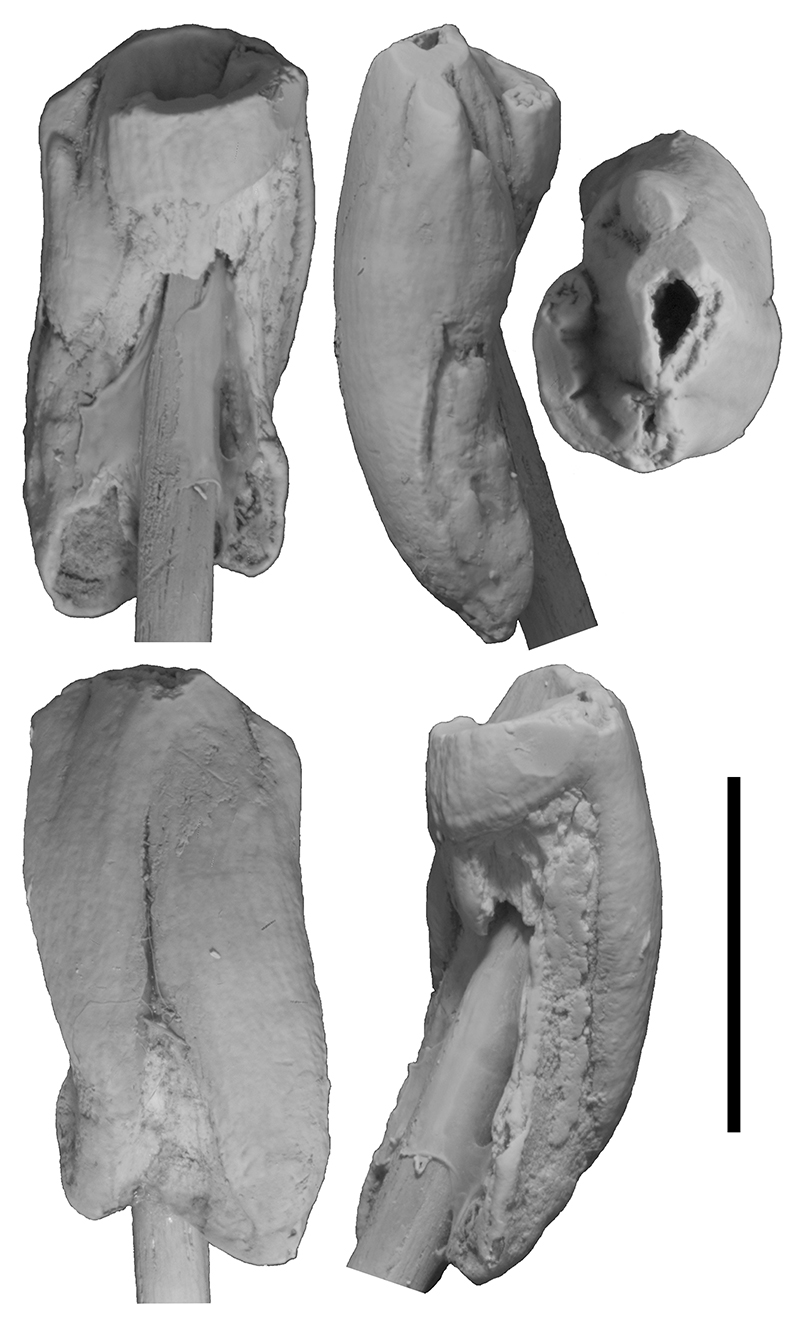
FIGURE 10. Upper molars of Rhizophascolonus ngangaba in lingual, anterior, buccal, posterior and occlusal view (left to right). 1. QM F23772, left M1 from Camel Sputum Site. 2. QM F23765, left M1 from Upper Site. QM F20706, left M (probably M2 or M3) from Camel Sputum Site. Scale bar represents 10 mm.
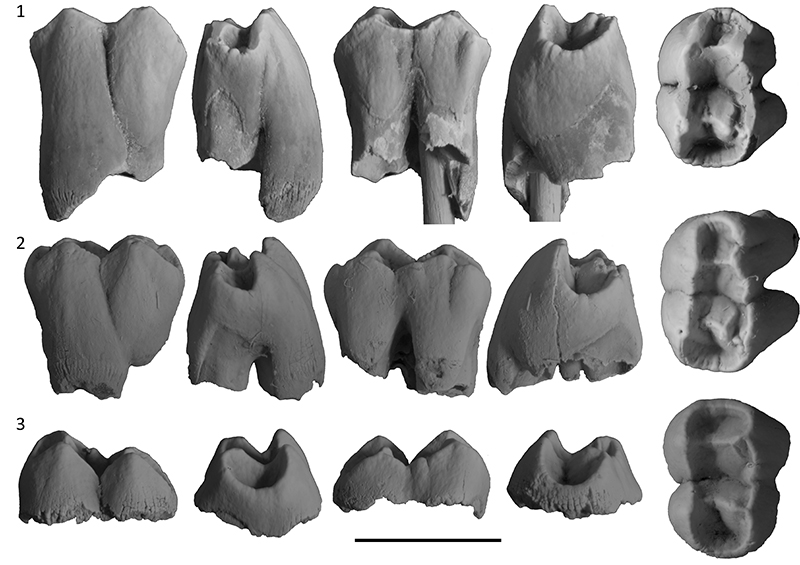
FIGURE 11. m1 of R. ngangaba in buccal, anterior, lingual, posterior and occlusal view (left to right). 1. QM F57967, right m1 from Camel Sputum Site. 2. QM F23764, right m1 from Upper Site. Scale bar represents 10 mm.
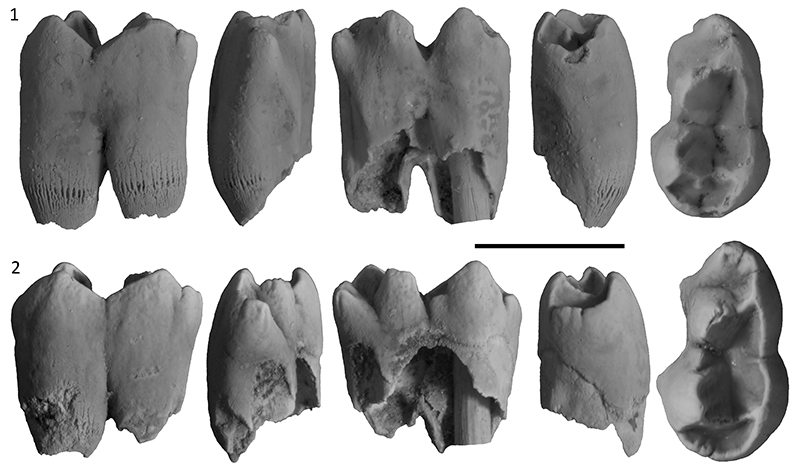
FIGURE 12. Lower molars of R. ngangaba in buccal, anterior, lingual, posterior, and occlusal view (left to right). 1. QM F23768, left m (probably m2 or m3) from Upper Site. 2. QM F23769, anterior fragment of right m (probably m2 or m3) from Camel Sputum Site. 3. QM F57968, left m2 from Gen’s Grand Slam Site. Scale bar represents 10 mm.
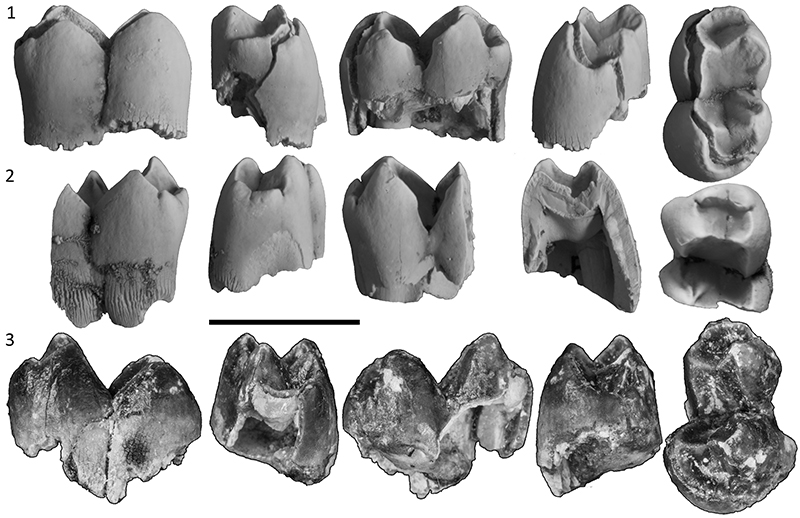
FIGURE 13. Comparison of cusp morphology of teeth of (left to right) R. ngangaba, R. crowcrofti, Phascolarctidae, Vombatus ursinus and Lasiorhinus latifrons. 1. Left P3 and M1-2. 2. Right p3 and m1-2. Phascolarctidae is represented by Priscakoala lucyturnbullae (images from Black et al., 2012) for M1-2 and m1, other tooth positions represented by P. cinereus. PR, protocone; PA, paracone; ME, metacone; MEL, metaconule; prd, protoconid; med, metaconid; hyd, hypoconid; end, entoconid. Images are not to scale and are comprised of multiple individuals in order to show the unworn dentition.
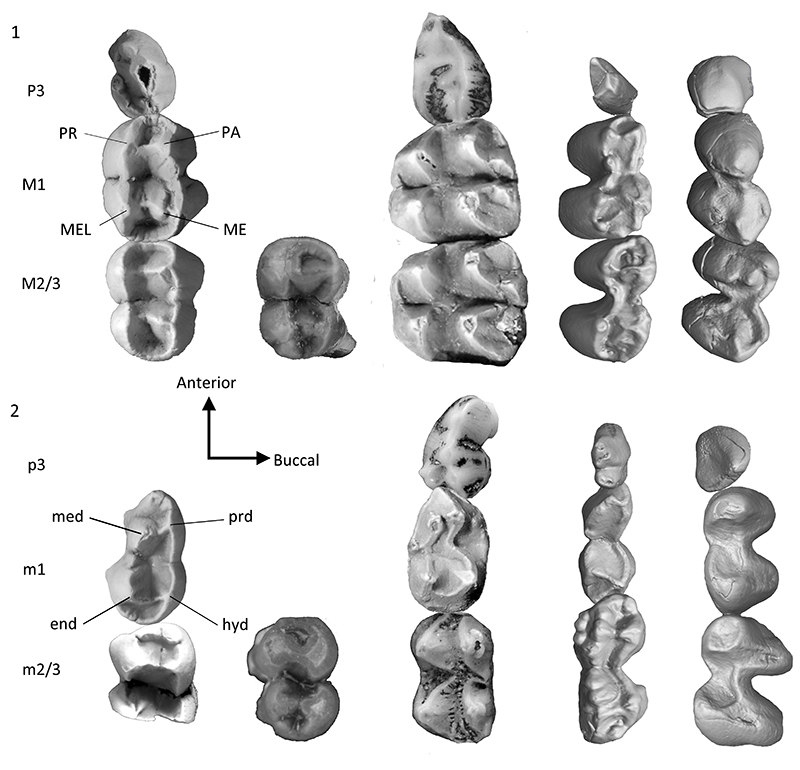
FIGURE 14. QM F57966, left p3 or dp3 from Cleft of Ages Site in occlusal view from buccal (left side, upper and lower rows) and lingual aspects (right side, upper and lower rows). Scale bar represents 1 mm.
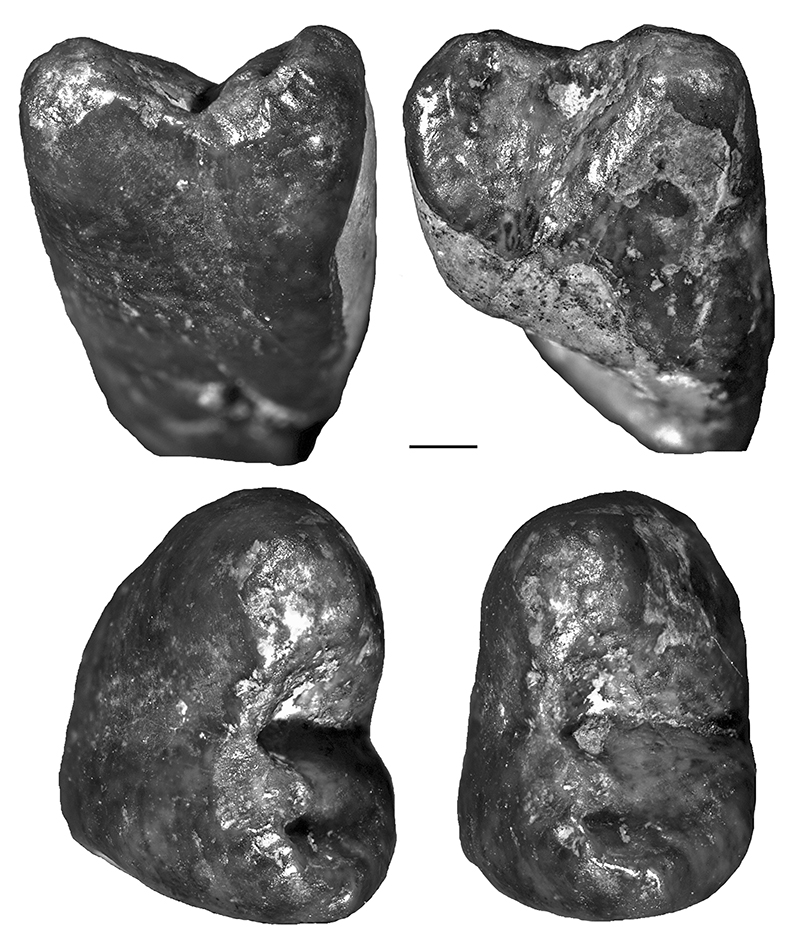
FIGURE 15. QM F23763, fragment of juvenile left mandible with ?m3-m4 in buccal, occlusal and lingual view (top to bottom). Scale bar represents 10 mm.
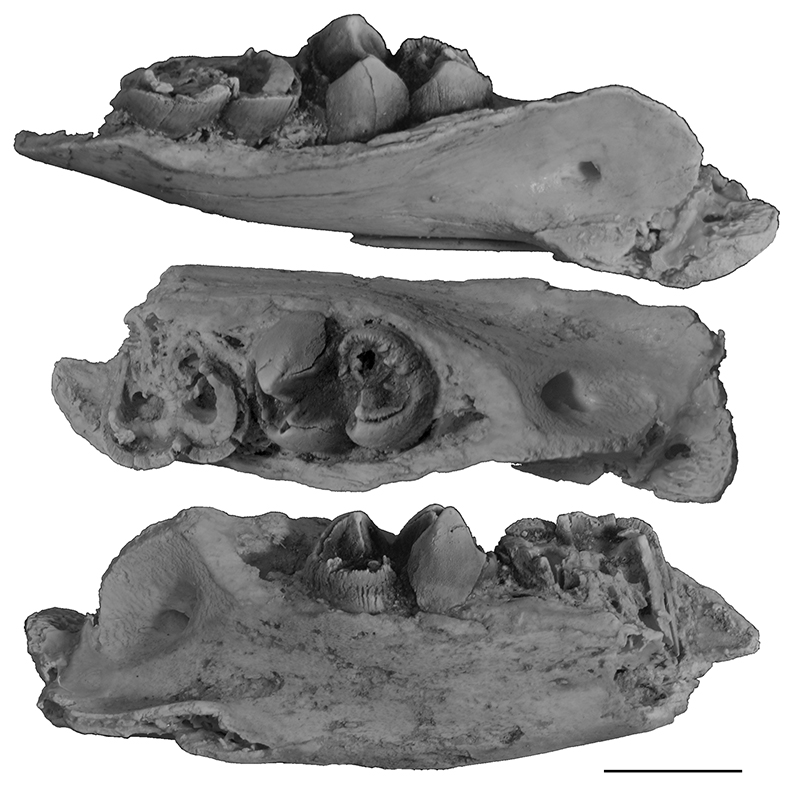
FIGURE 16. Maxillary fragments of Rhizophascolonus sp. from Baker’s Delight Site. 1. QM F57964, right maxillary fragment with M2-3 in lingual, anterior and buccal view (top row) and posterior and occlusal view (bottom row). 2. QM F57965, left maxillary fragment with M2-4 in occlusal view. Scale bar represents 10 mm.
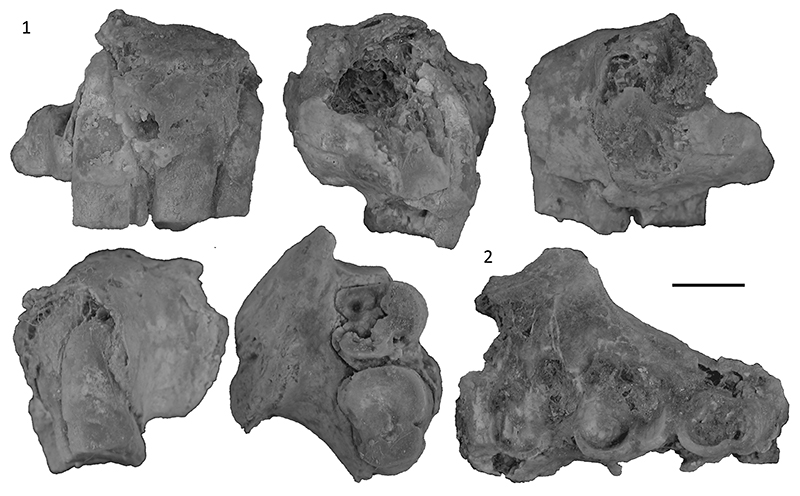
FIGURE 17. QM F20613, left mandibular fragment with m2-4 of Rhizophascolonus sp. from Bone Reef Site. 1. Buccal (medial) view. 2. Occlusal view. 3. Lingual (lateral) view. Scale bar represents 10 mm.
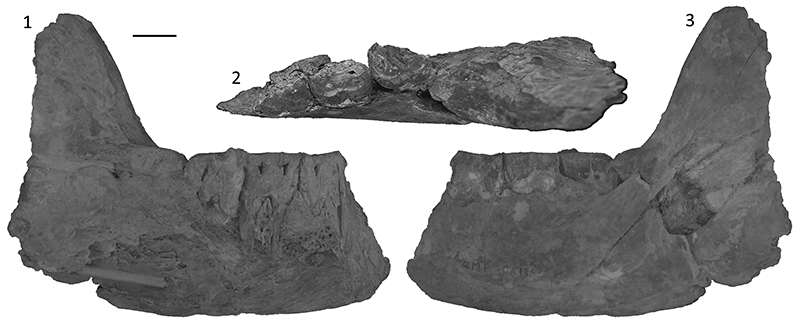
FIGURE 18. Results of the phylogenetic analysis. 1. Strict consensus tree of 9 most parsimonious trees (MPTs) before pruning. 2. Tree 1 of 3 MPTs after removing Ramsayia magna from the analysis. 3. Tree 2 of 3 MPTs after removing R. magna from the analysis. 4. Tree 3 of 3 MPTs after removing R. magna from the analysis. 5. Strict consensus of 3 MPTs after removing R. magna from the analysis. 6. 50% majority rule consensus tree after removing R. magna from the analysis. Numbers in circles indicate bootstrap support.
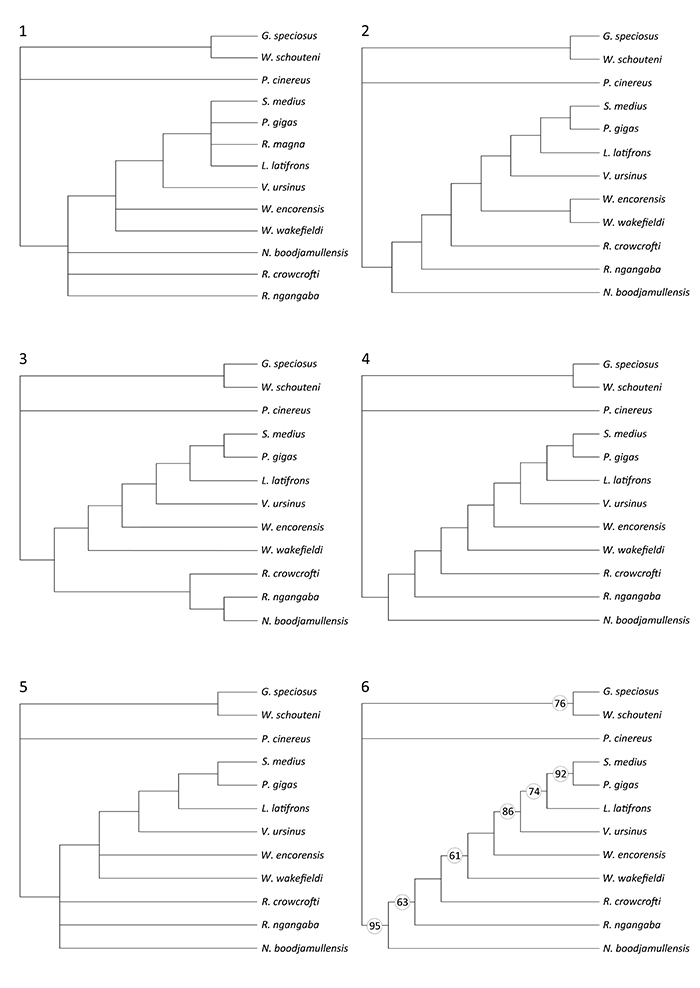
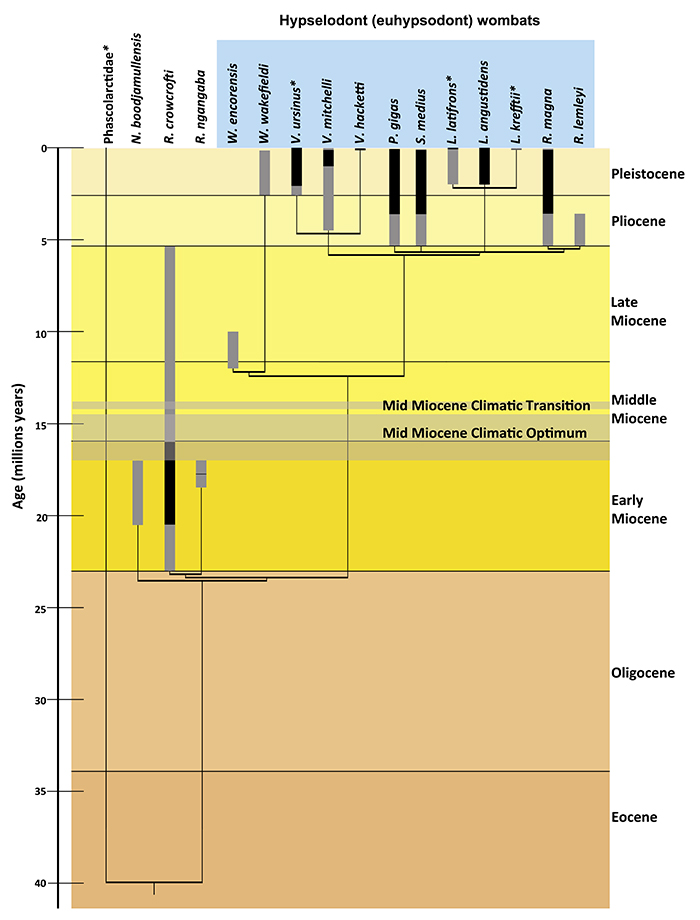
FIGURE 19. Results of the phylogenetic analysis with additional species added (relative branching order of these additional taxa are shown here as not resolved) against the geological time scale (Gradstein et al., 2012). Age span of deposits containing all known wombat taxa are provided, with black bars indicating certainty (such as radiometrically dated sites) and grey indicating uncertainty (ages are based on Archer and Wade, 1976; Archer et al., 1989, 1997, 2016; Arena et al., 2016; Beck, 2008; Beheregaray et al., 2000; Black, 1997; Black et al., 2012b; Cupper and Duncan, 2006; Dawson, 1985; Hope and Wilkinson, 1982; Myers et al., 2001, 2017; Piper et al., 2006; Pledge, 1992; Price et al., 2009, 2011; Prideaux et al., 2010; Vickers-Rich et al., 1991; Roberts et al., 2001; Stirton et al., 1967; Taylor et al., 1994; Tedford et al., 2006; Travouillon et al., 2006, 2011; Whitelaw 1989, 1991; Woodhead et al., 2014). Age of split between taxa is based on oldest possible deposits containing those taxa and as such will change as more information becomes available. Asterix indicates taxon is extant.