FIGURE 1. Locality map showing the San Leonardo quarry tracksite, Apulia, southern Italy. Image obtained using Google Earth Pro.
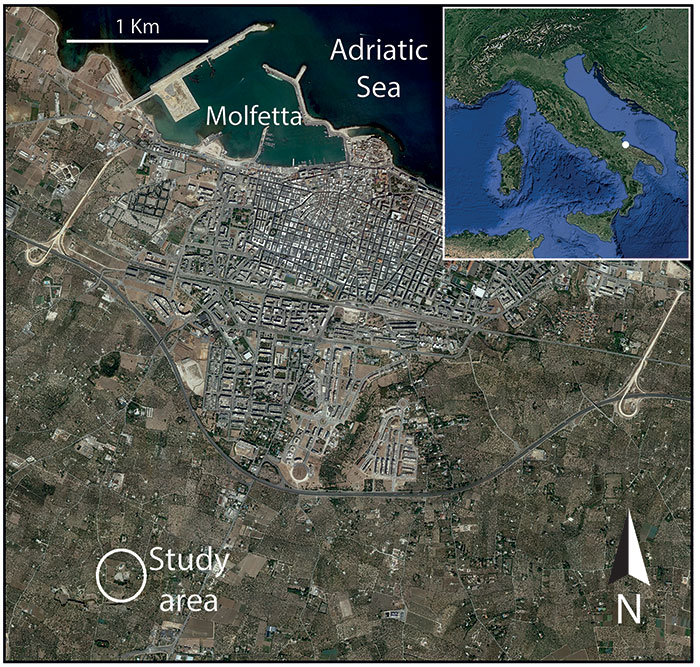
FIGURE 2. Molfetta tracksite - Map of the trampled surface.
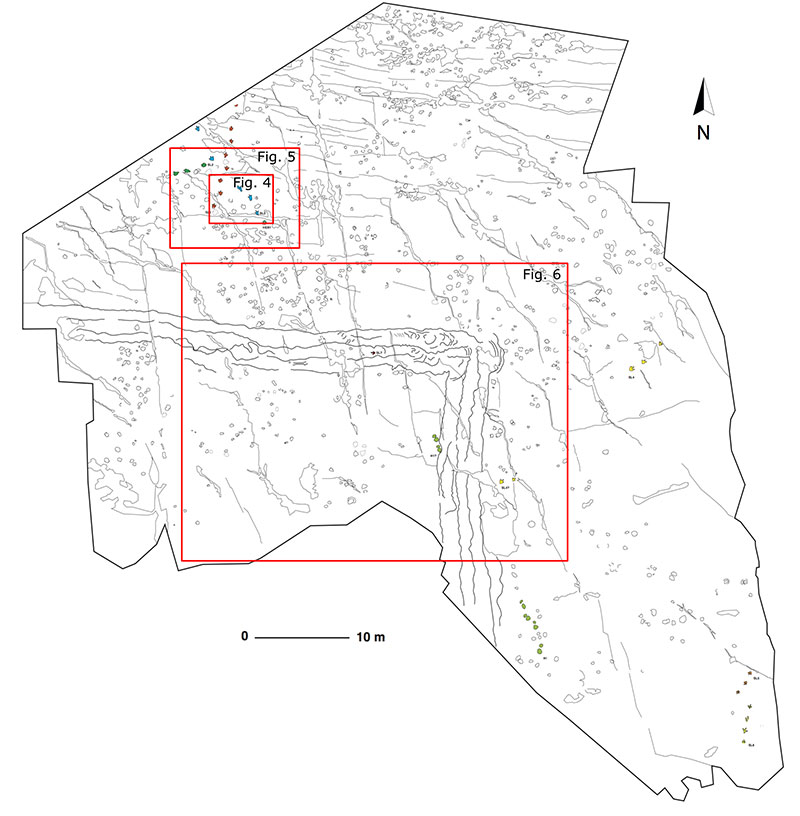
FIGURE 3. The UAVs (Unmanned Aerial Vehicles) used for aerial survey of the tracksite. 1, quadcopter SZ DJI Phantom 4; 2, hexacopter Tarot FY680 Pro.
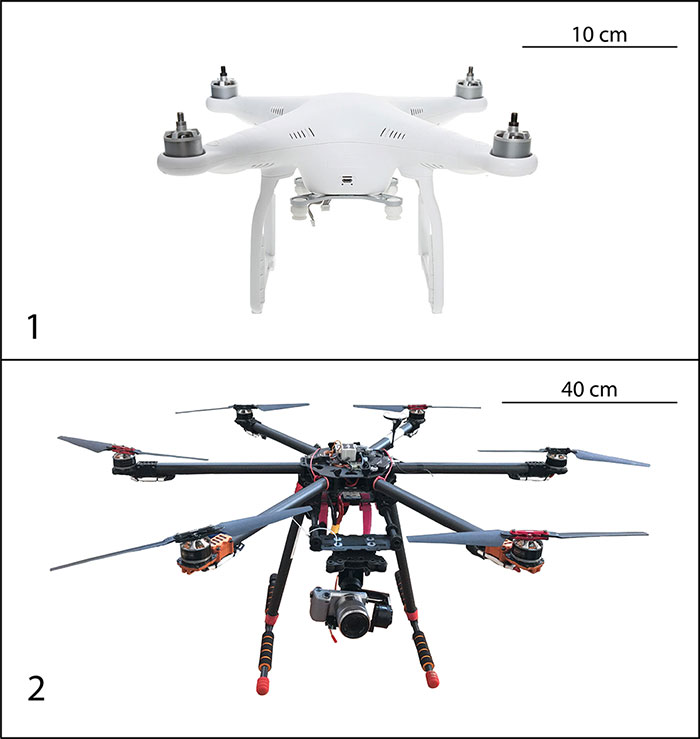
FIGURE 4. Comparison of the results obtained on a sample area. 1, orthophoto; 2, DEM; 3, slope raster map produced by the quadcopter at flight height of 30 m; 4, orthophoto; 5, DEM; 6, slope raster map produced by the quadcopter at a flight height of 10 m; 7, orthophoto; 8, DEM; 9, slope raster map produced by the hexacopter at a flight height of 15 m.
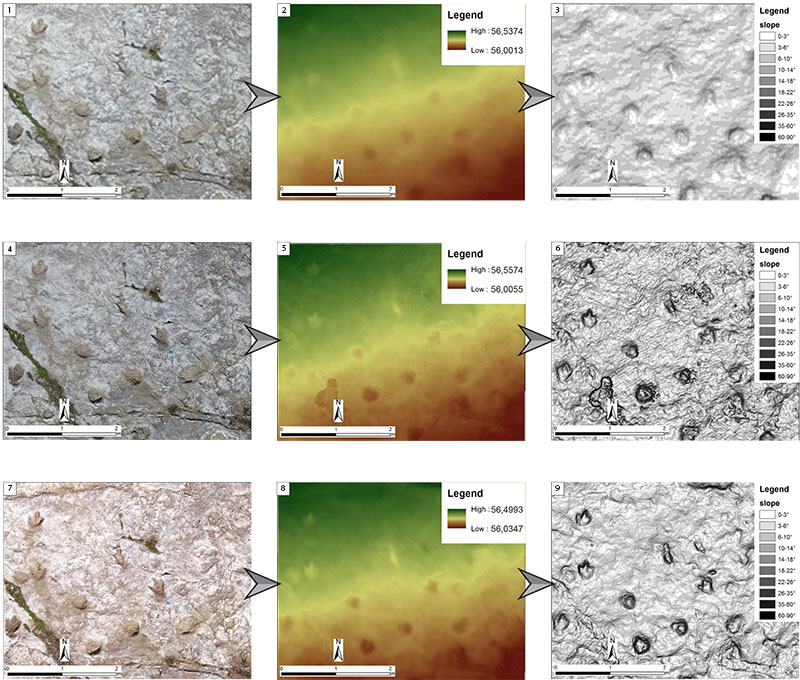
FIGURE 5. Comparison of the products generated for one of the most trampled sector. 1, orthophoto raster map; 2, hillshade raster map; 3, slope raster map; 4, contour lines vector map.
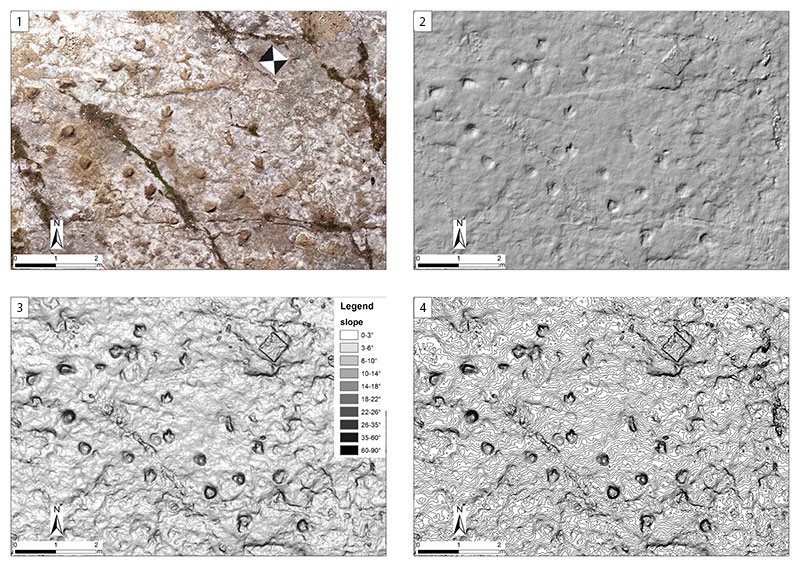
FIGURE 6. Comparison of the products generated for the sector including the “L-shaped trace”. 1, orthophoto raster map; 2, hillshade raster map; 3, slope raster map; 4, contour lines vector map.
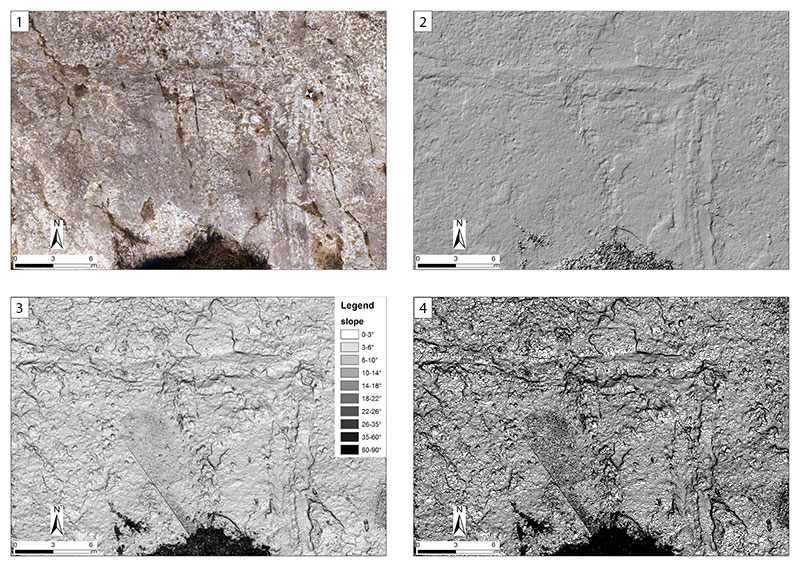
FIGURE 7. Orthophotomosaic of the Molfetta tracksite produced by the aerial survey performed with the hexacopter.
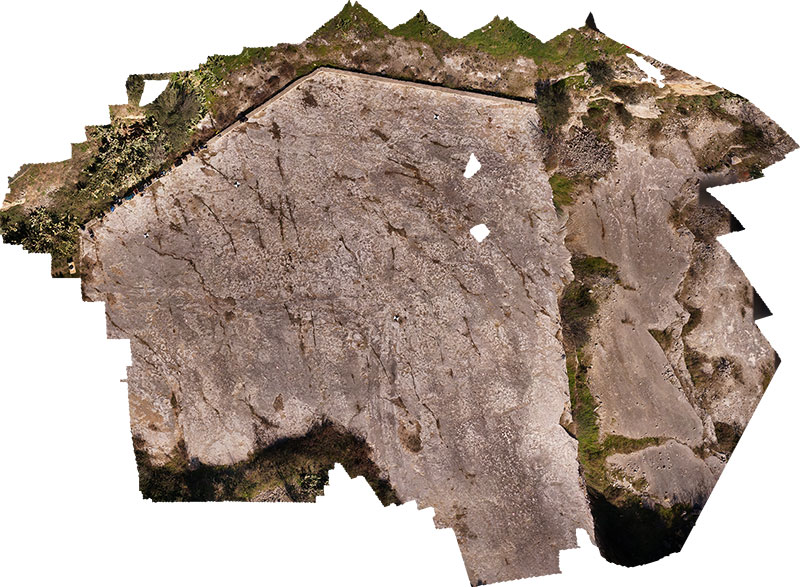
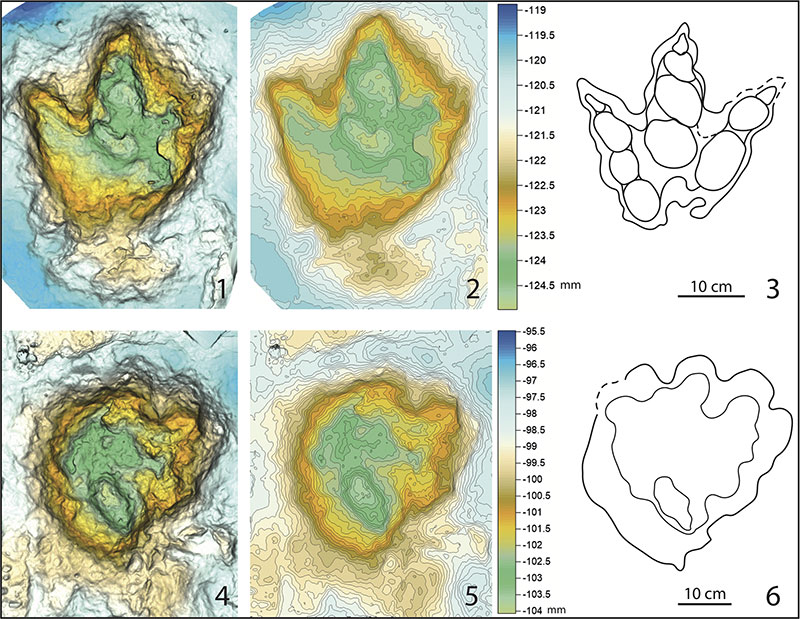
FIGURE 8. Molfetta dinosaur tracks, photogrammetry derived 3D models and interpretations; 1-2, DEM and contour line map of a theropod footprint (contour lines have an interval of 0.2 cm); 4-5, DEM and contour line map of an ornitischian footprint; 3 and 6, interpretative outline drawings of the studied tracks.