FIGURE A1.1. Variation in total shell volume with exposure time when different surface determination calculation methods are used. Three scans were interpreted for this graph, one from each exposure time.
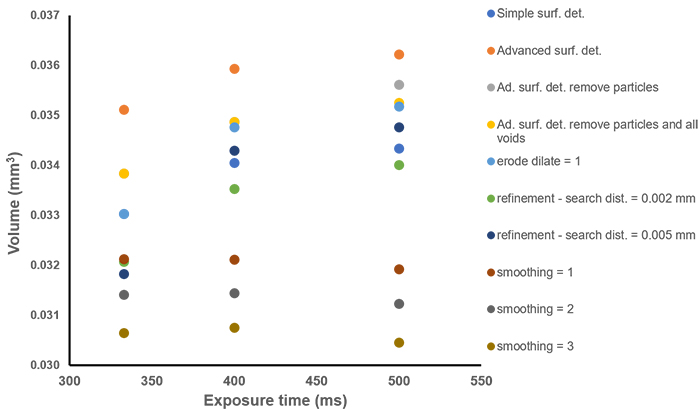
FIGURE A1.2. The range of volume measurements for each exposure times when three scans were reconstructed using ten methods. The blue dot represents the simple surface determination used for all shells in this study. The error bars represent the data range for each exposure time.
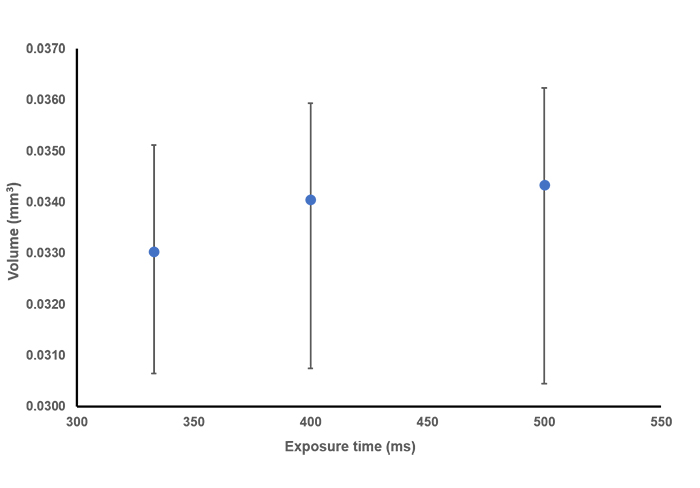
FIGURE A2. Box and whisker plots of impact of the number of x-ray radiographs averaged per view on the signal-to-noise ratio of (1) the background, and (2) the shell material. The background SNR increases with increased number of averages because this random noise is averaged out as more x-ray radiographs are collected. The material SNR decreases with increasing number of x-ray radiographs which suggest the data are noisy and the noise is not random. Data are available in Appendix 4.
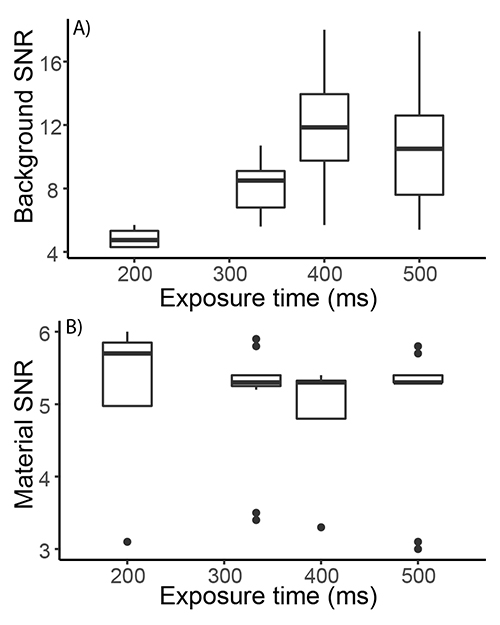
FIGURE A3. Box and whisker plots displaying the impact of exposure time on the signal-to-noise ratio of (1) the background, and (2) the shell material. The background SNR is significantly higher at exposure times of 400 and 500 ms relative to 200 and 333 ms (t-test, t = 3.0432, p = 0.007403). The material SNR decreases and then is unaffected by increased exposure time. This may suggest that when scanning this specimen with a high current, signal is not a limiting factor. Data are available in Appendix 4.
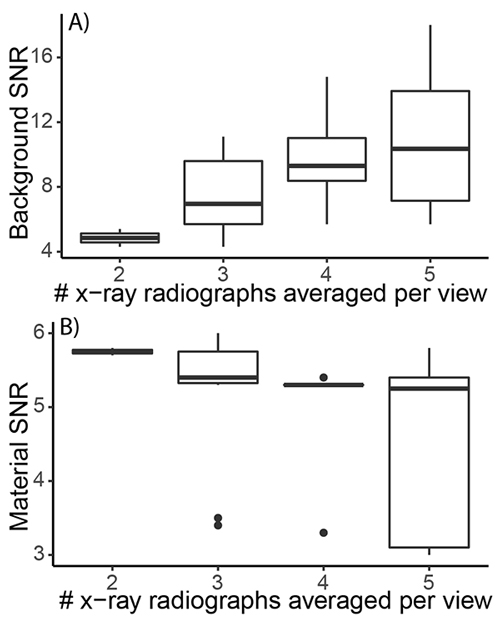
FIGURE A4. Box and whisker plots display the impact of overall scan time on the signal-to-noise ratio of (1) the background, and (2) the shell material. The background SNR increases with increasing scan time, however, the material signal to noise ratio decreases with increasing overall scan time. Data are available in Appendix 4.
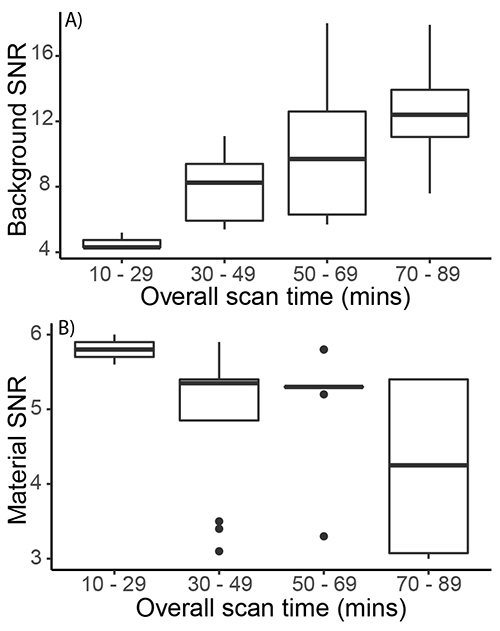
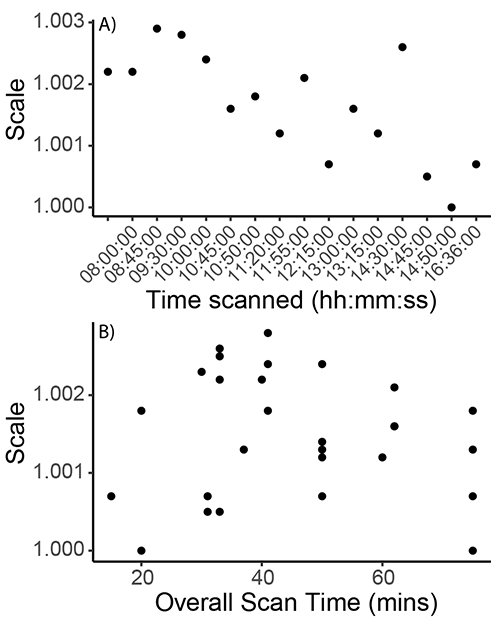
FIGURE A5. Scatter plot displaying how beam shift, measured by the apparent growth (scale) of the shell in the final x-ray radiograph relative to the first x-ray radiograph, varies with (1) time of day the scan was performed, and (2) the overall scan time. We found that beam shift decreased throughout the day, likely due to the tube warming up as more scans are run. There was no correlation between overall scan time and the amount of beam shift.