FIGURE 1. Map of the United States and surrounding regions, showing the location of the state of Florida and FMMS (Google 2017). 1B: Geologic map of the State of Florida, showing the geographic distribution of rocks and the location of the FMMS (Google 2017; Scott et al. 2001). 1C: Geologic map of the region around the FMMS, showing the distribution of rocks and location of the site (Google 2017; Scott et al. 2001). 1D: Photograph of FMMS, taken by Fred Mazza.
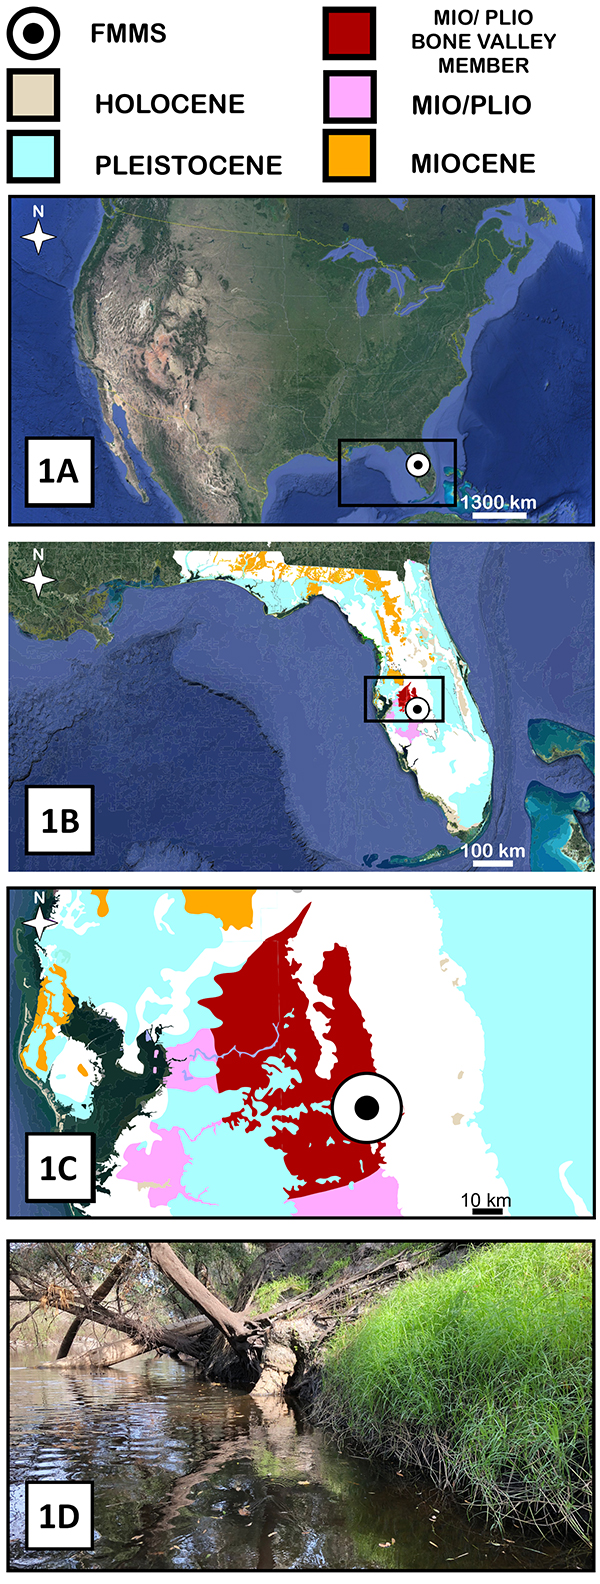
FIGURE 2. Stratigraphic column of FMMS.
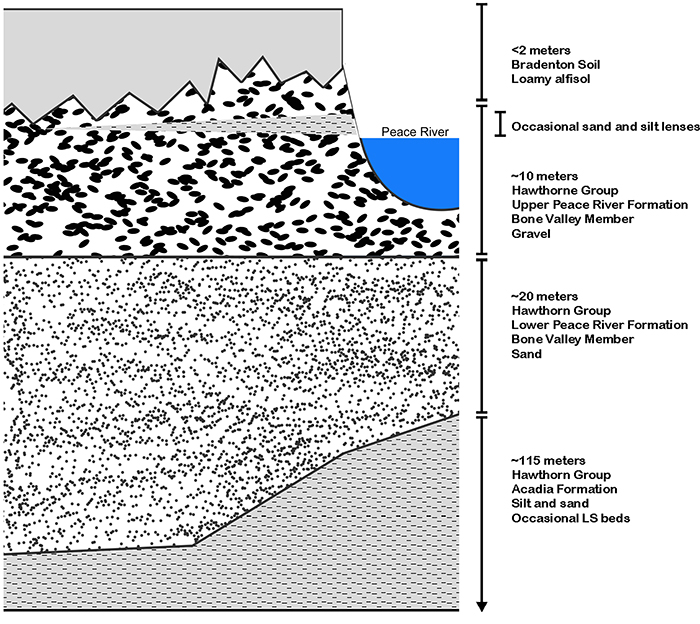
FIGURE 3. The setup used to photograph bromalites for the identification guides.
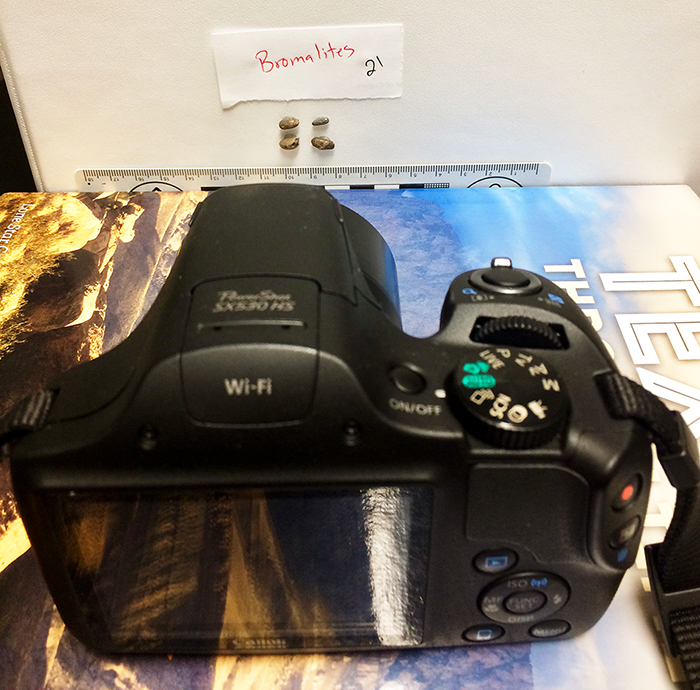
FIGURE 4. Isolated images of †Hemipristis serra used in the identification guides. 4A: color guide. 4B: grayscale guide. 4C: illustrated guide.
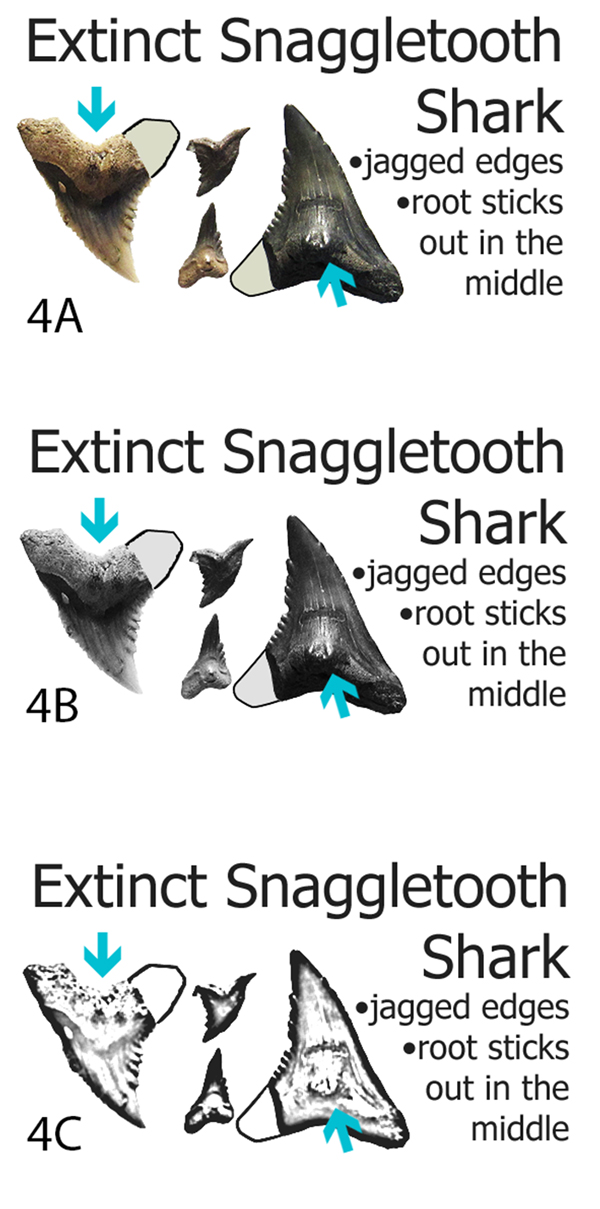
FIGURE 5. Participants at La Vega Junior High using the color photograph identification guide, data sheet, sorting trays, and magnifying lenses to identify and record fossils.
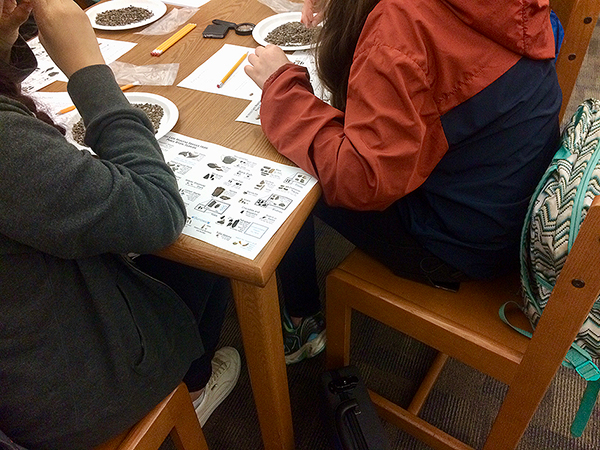
FIGURE 6. Bar graph of similarity data for different guide formats. 6A: presence/absence data using Sdice; 6B: relative abundance data using Sbc. ‘Experts’ combines data from the authors, who each have substantial paleontology experience.

FIGURE 7. Bar graph of similarity for different guide formats with the highest and lowest performer truncated from each group. 7A: presence/absence data using Sdice; 7B: relative abundance data using Sbc. ‘Experts’ combines data from the authors, who each have substantial paleontology experience.
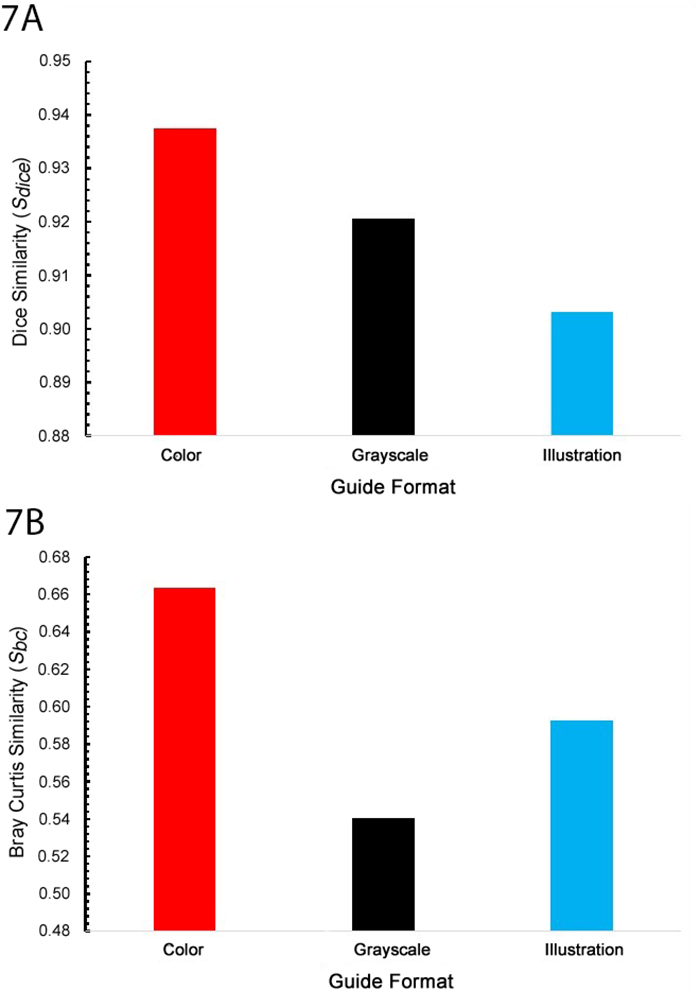
FIGURE 8. Cluster analyses of all subjects as individuals. Subject labels denote which field guide the subject tested, a red ‘C’ for color photos, a black ‘G’ for grayscale photos, and a blue ‘I’ for illustrations. Author names are abbreviated “DaBu” for Dava Butler, “DoEs” for Donald Esker and “KrJu” for Kristopher Juntunen.
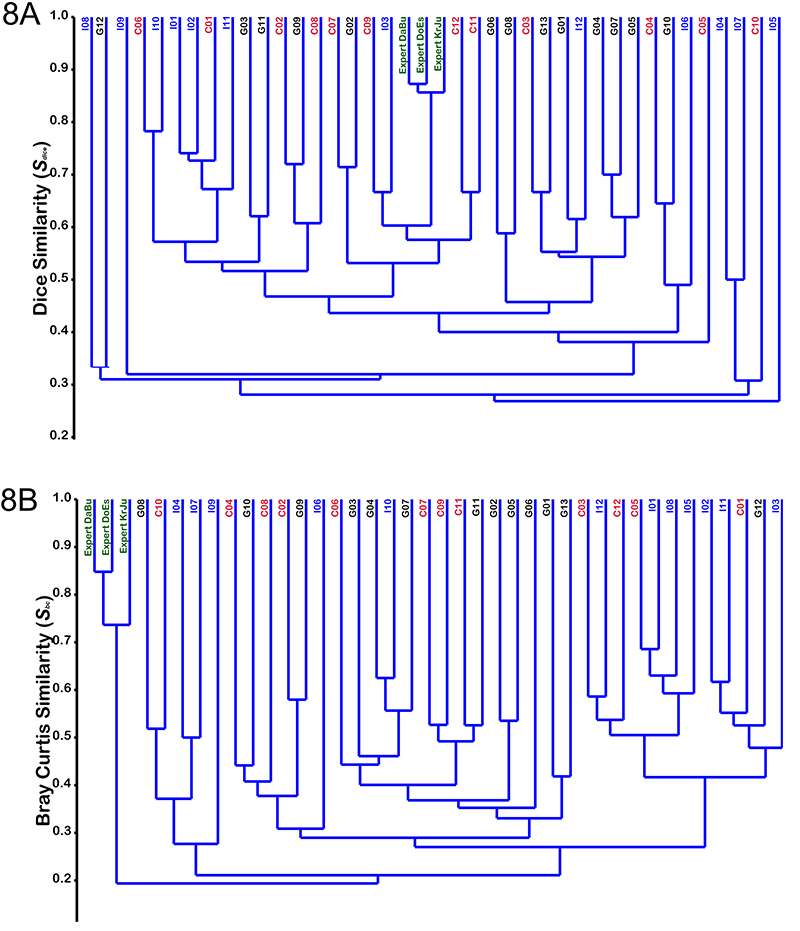
FIGURE 9. Regressions of accuracy data reported by participants organized by educational background. ‘8’and ‘9’ represent the last year of middle school and the freshman year of high school, respectively. ‘13’ represents a bachelor’s degree in any subject, ‘14’ represents a master’s degree in any subject, and ‘15’ represents a PhD or equivalent degree in any subject. Black dots indicate mean accuracy for an educational background, the solid curve indicates a logarithmic regression for that accuracy data, and dashed curves show the 2σ confidence interval. 9A: regression of data accuracy using Sdice; 9B: regression of data accuracy using Sbc.
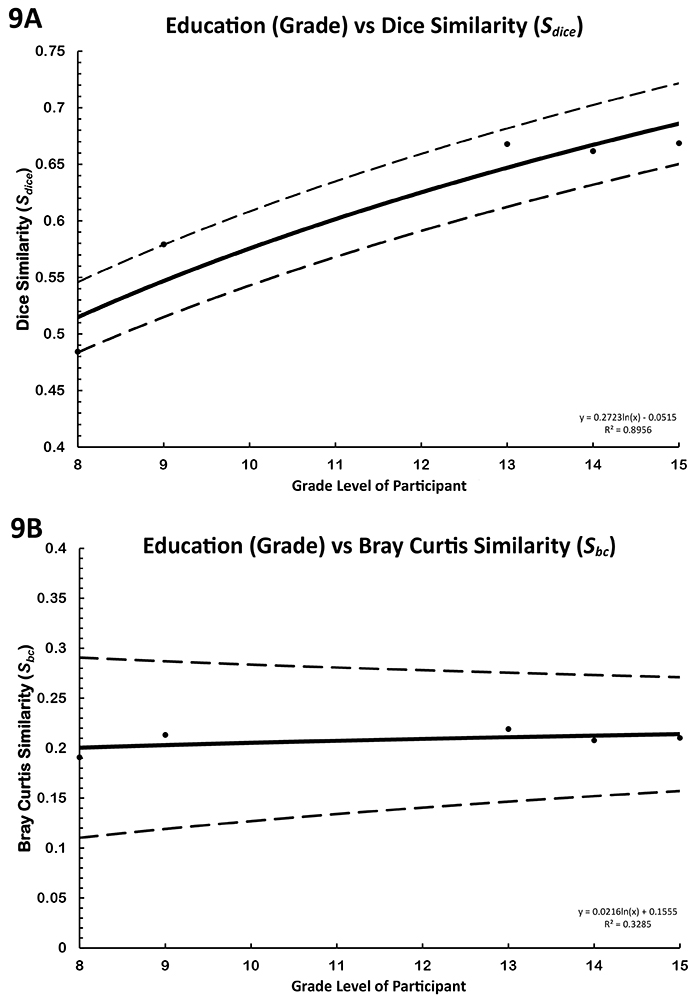
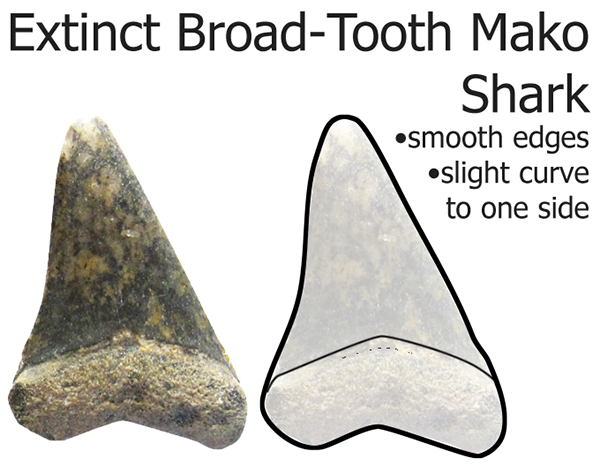
FIGURE 10. An example of a †Cosmopolitodus hastalis photo enhanced by illustration.