FIGURE 1. Outline of Namibia and South Africa with the location of the cores studied. The intervals for the bathymetric lines in the upper left map are 100 m (based on maps provided by Minemakers Australia Pty. Ltd.).
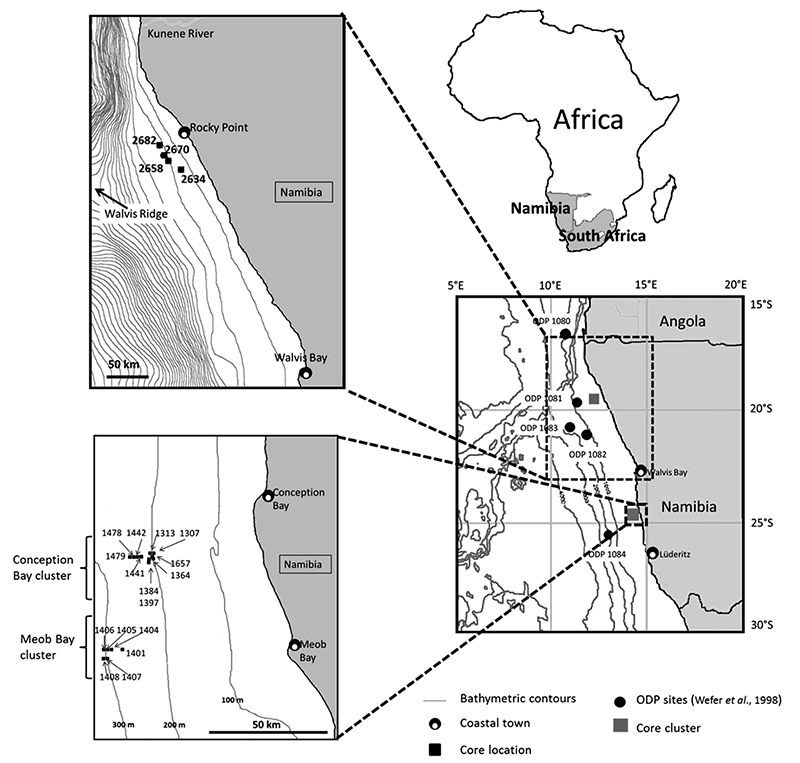
FIGURE 2. Stratigraphy of the Conception and Meob Bay cores. The depositional ages and units are defined by Compton and Bergh (2016). Unit 6 = reworked foram layer; unit 5 = brown to olive-green mud unit; unit 4 = pelletal phosphorite sandy layer; unit 3 = slightly shelly layer; unit 2 = shelly sandy layer; unit 1 = shelly gravel layer (Compton and Bergh, 2016).
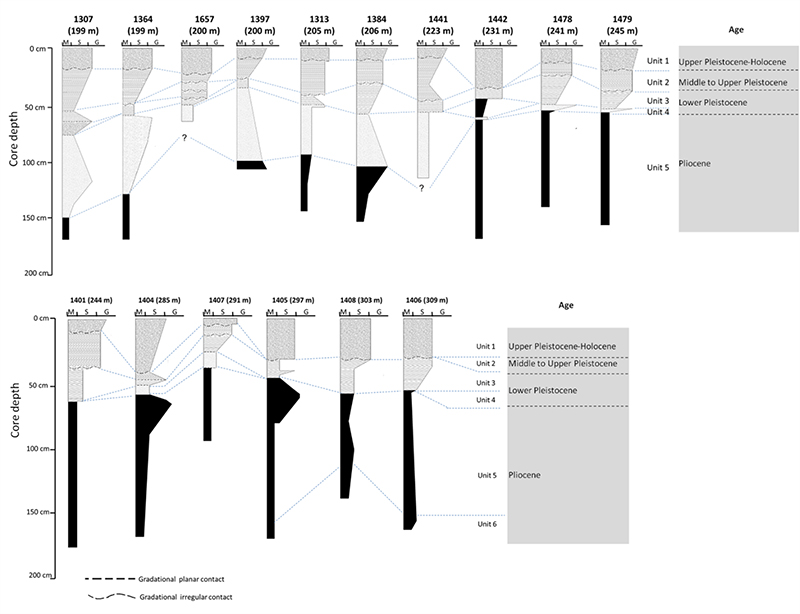
FIGURE 3. Mean relative abundance, represented by column charts, of the major components within the complete sand fractions of core 1479.
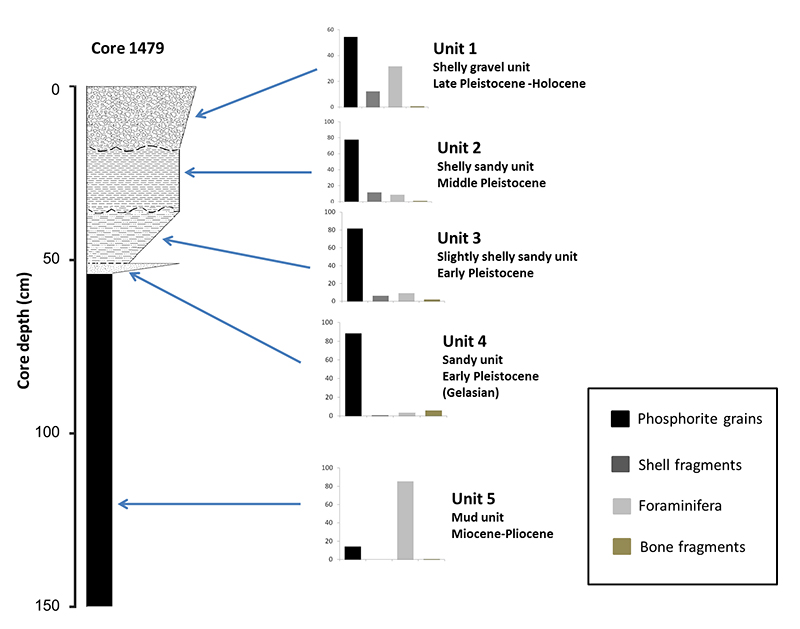
FIGURE 4. Mean relative abundance of planktic species preserved across the three units of the Walvis Bay-Lüderitz cores.
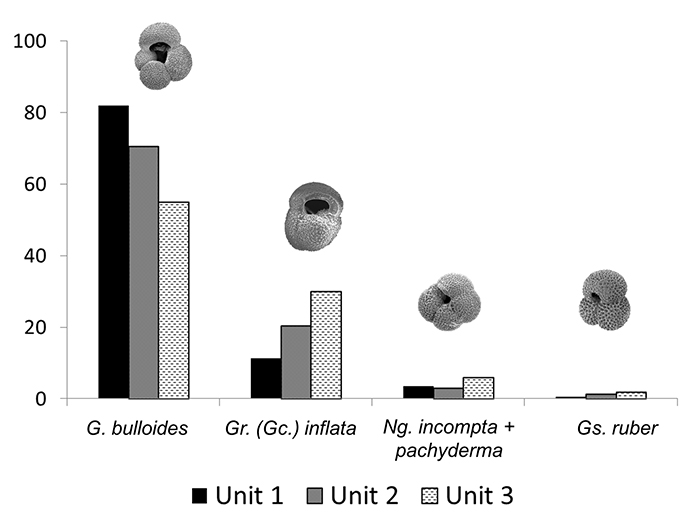
FIGURE 5. Relative abundances (%) of benthic foraminifera in the shelly sandy units 1-3. Mean relative abundances of the major taxa in each unit over all the cores in which the foraminifera species counted are indicated upper right.
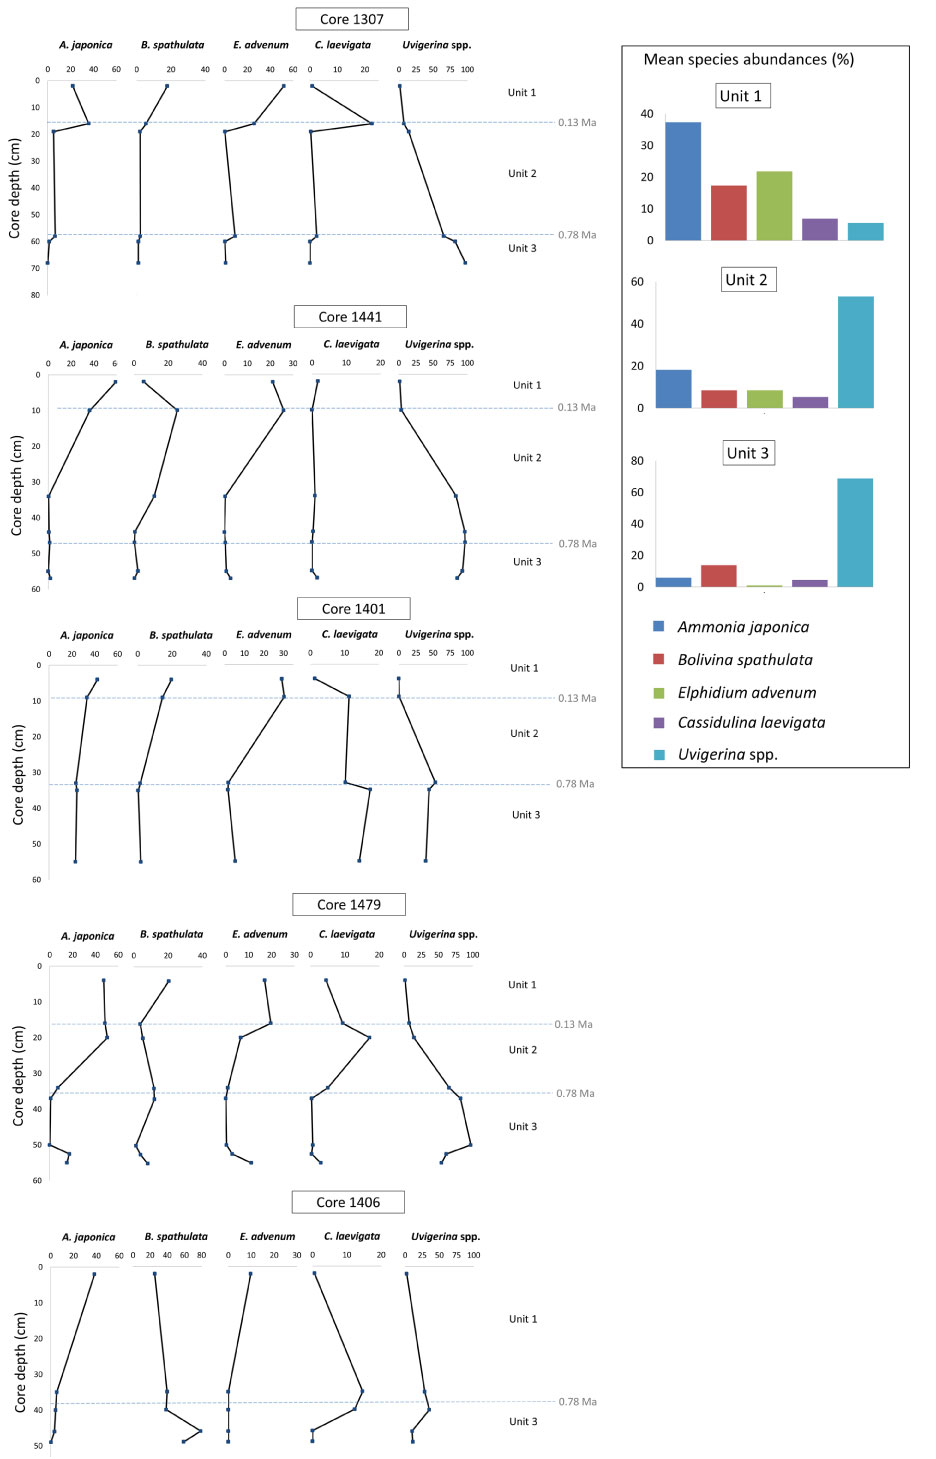
FIGURE 6. Dendrogram from a hierarchical cluster analysis (Ward’s method) based on Euclidean distance as similarity index to determine sub-assemblages. The sample number refers to the core and core depth (in cm). A = core 1307; B = core 1441; C = core 1401; D = core 1479; E = core 1406
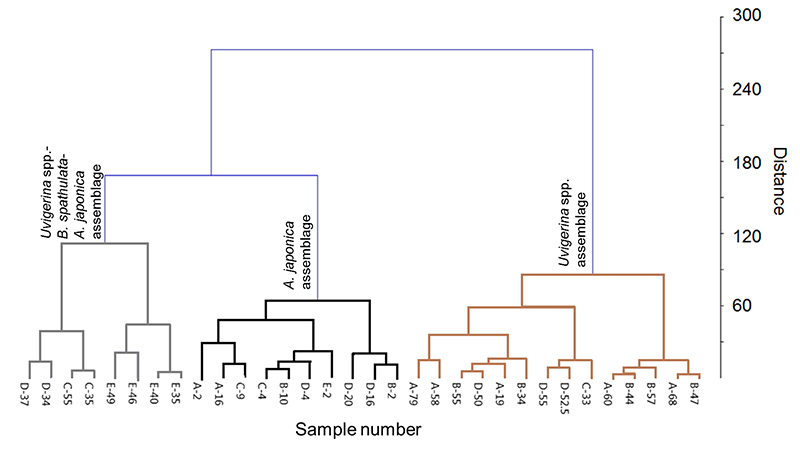
FIGURE 7. Mean relative abundances of mollusc (bivalves on the left and gastropods on the right) shells in the Walvis Bay-Lüderitz cores.
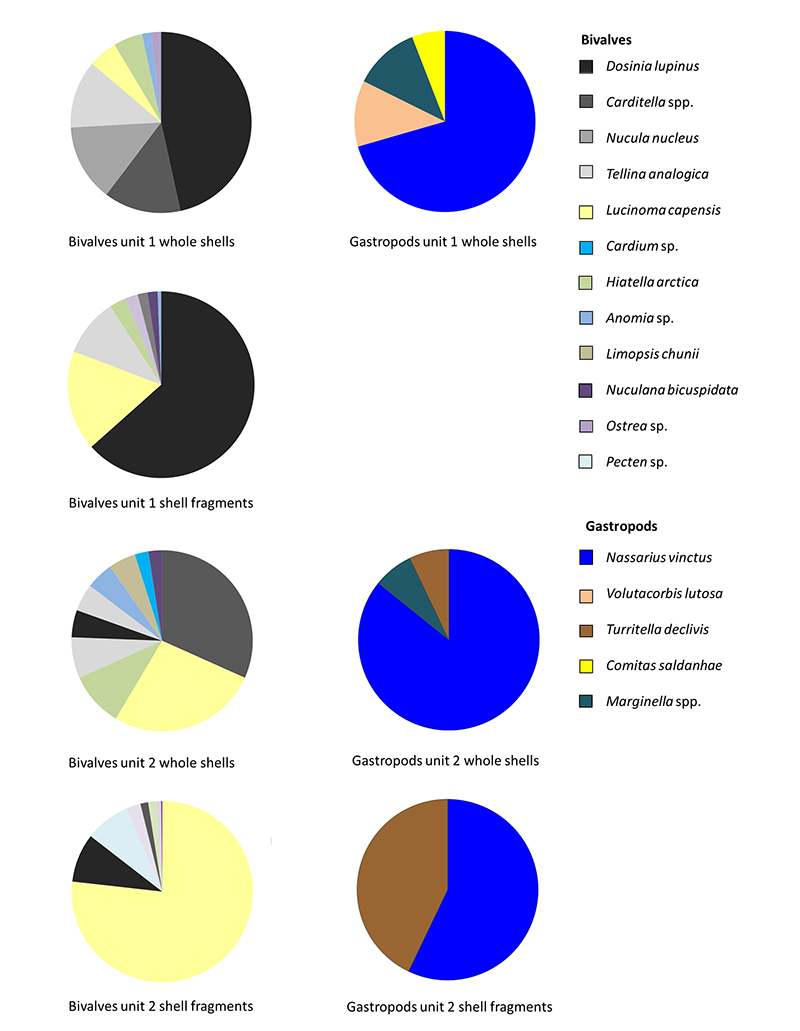
FIGURE 8. Mollusc shells from the gravel fraction of the uppermost 2 units of the Walvis Bay-Lüderitz cores. 1. Dosinia lupinus (Linnaeus, 1758) (core 1407, 0-4 cm sampling interval); 2. Lucinoma capensis (Jaeckel and Thiele, 1931) (core 1397, 0-4 cm); 3. Tellina (Moerella) analogica Sowerby III, 1904 (core 1478, 8-12 cm); 4. Ostrea sp. (core 1657, 0-4 cm); 5. Nassarius vinctus (Marrat, 1877) (core 1407, 0-4 cm); 6. Turritella declivis Adams and Reeve, 1850 (core 1657, 20-24 cm); 7. Comitas saldanhae (Barnard, 1958) (core 1307, 0-4 cm).
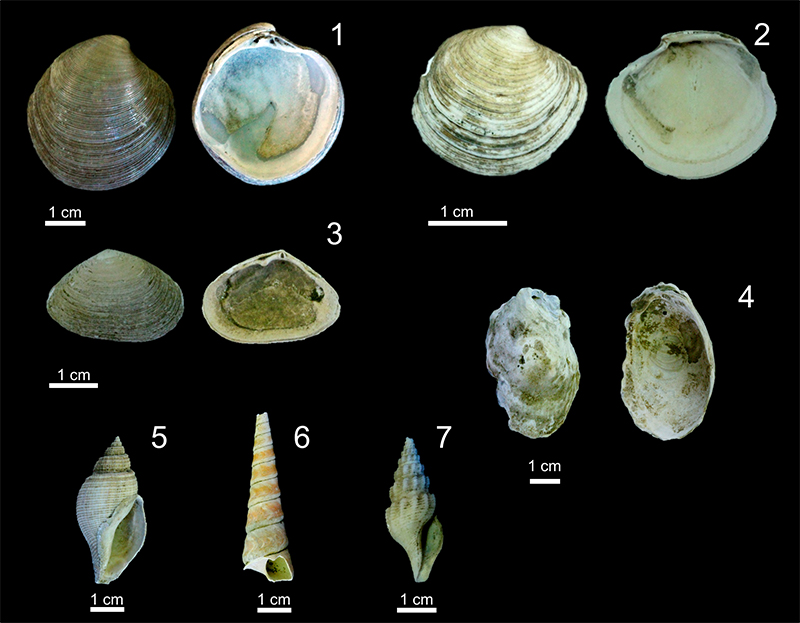
FIGURE 9. Mean relative abundances of mollusc shells (bivalves on the left and gastropods on the right) in the northern Namibian cores.
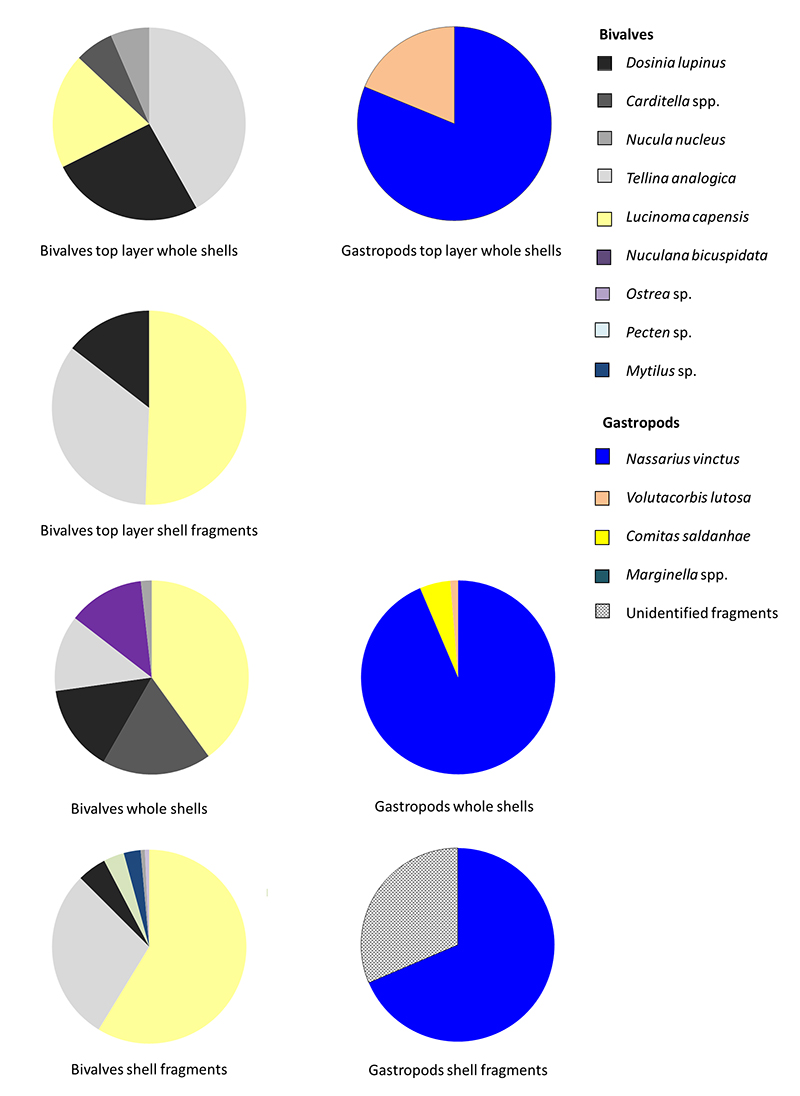
FIGURE 10. Whole and fragmented shells (top) (core 2658, 10-15 cm sampling interval), Nuculana bicuspidata (bottom left) shells including articulated valves (core 2634, 78-85 cm) and Pecten spp. fragments (bottom right) (core 2658, 88-90 cm) from the northern Namibian cores.
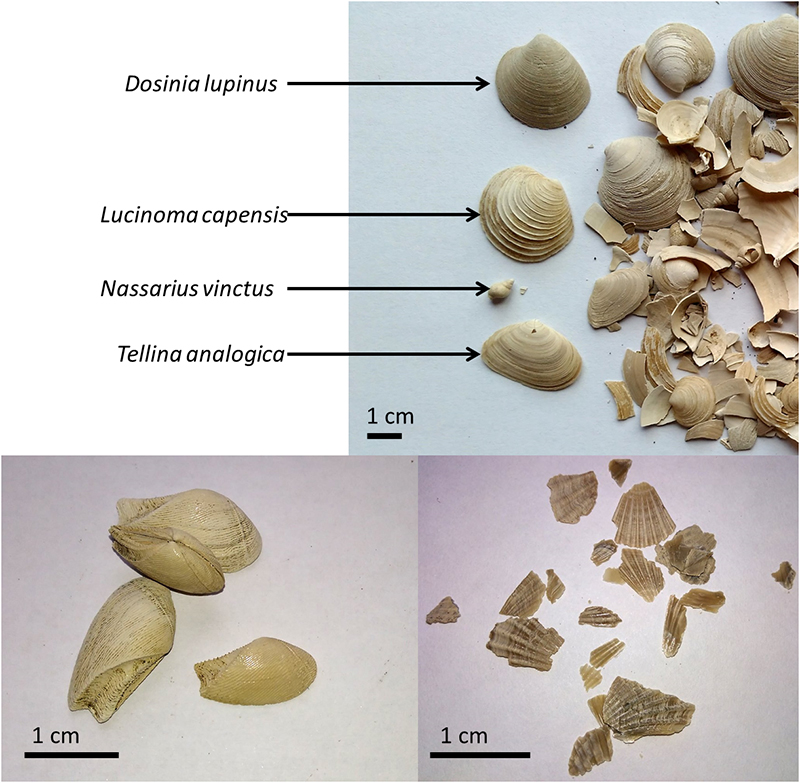
FIGURE 11. Planktic foraminifera from the Namibian outer shelf with primary apertural views visible. 1. Globorotalia (Globoconella) inflata (d’Orbigny, 1839b) (core 2670, 98 cm); 2. Globorotalia menardii (Parker, Jones and Brady, 1865) (core 2670, 23 cm); 3. Globorotalia truncatulinoides (d’Orbigny, 1839b) (core 2670, 23 cm); 4. Neogloboquadrina dutertrei (d’Orbigny, 1839a) (core 2670, 43 cm); 5. Neogloboquadrina incompta (Cifelli, 1961) (core 2670, 85 cm); 6 Globigerina bulloides d’Orbigny, 1826 (core 2670, 85 cm); 7. Globigerinella siphonifera (d’Orbigny, 1839b) (core 2670, 33 cm); 8. Globigerinoides ruber white (d’Orbigny, 1839a) (core 2670, 13 cm); 9. Trilobatus sacculifer (Brady, 1877) (core 2670, 63 cm); 10. Orbulina bilobata (d’Orbigny, 1846) (core 2670, 3 cm); 11. Orbulina universa d’Orbigny, 1839a (core 2670, 33 cm).
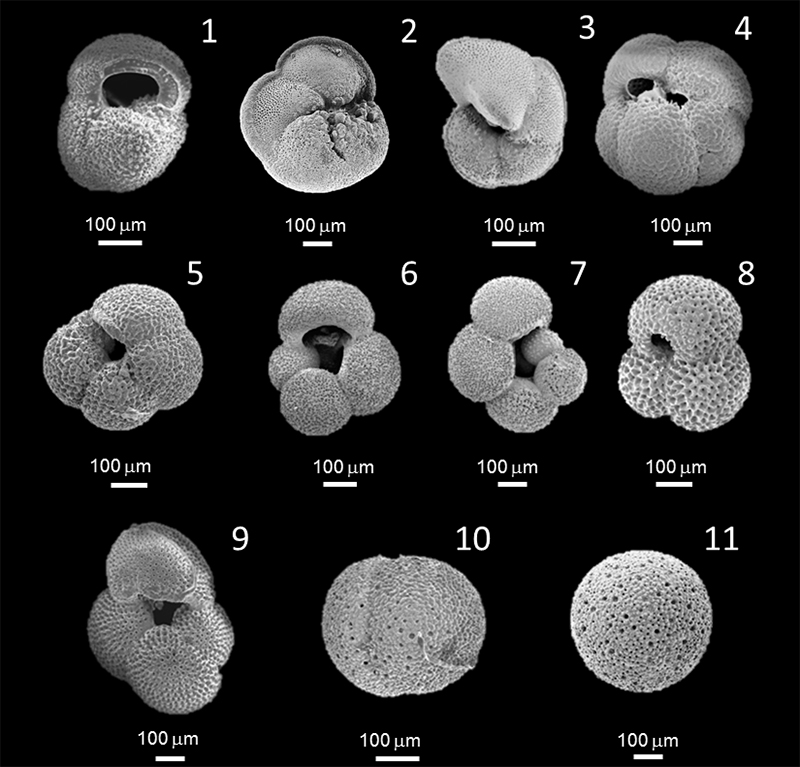
FIGURE 12. Distribution maps of benthic foraminifera occurring in Namibian and western South African outer shelf (blue shading = Lowry, 1987; black dots = Compton et al., 2002, 2004 and this study), lower to middle upper Quaternary sediments (green-yellow dots = McMillan, 1987) and inner shelf surface grab sediments (red-yellow dots = Schmidt-Sinns, 2008). Samples from McMillan (1987), Compton et al. (2002, 2004) and this study represent Pleistocene-aged foraminifera and samples from Lowry (1987) and Schmidt-Sinns (2008) are from surface grab sediments.
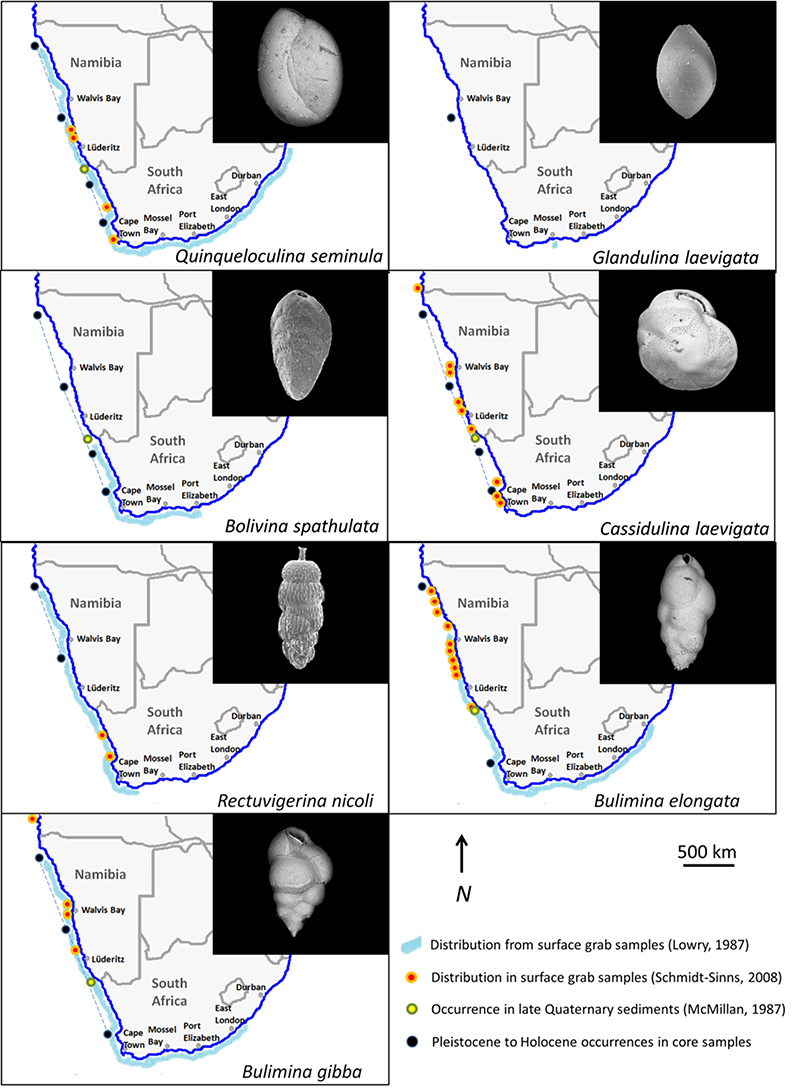
FIGURE 13. Distribution maps of benthic foraminifera occurring in Namibian and western South African outer shelf (blue shading = Lowry, 1987; black dots = Compton et al., 2002, 2004 and this study), lower to middle upper Quaternary sediments (green-yellow dots = McMillan, 1987) and inner shelf surface grab sediments (red-yellow dots = Schmidt-Sinns, 2008). Samples from McMillan (1987), Compton et al. (2002, 2004) and this study represent Pleistocene-aged foraminifera and samples from Lowry (1987) and Schmidt-Sinns (2008) are from surface grab sediments.
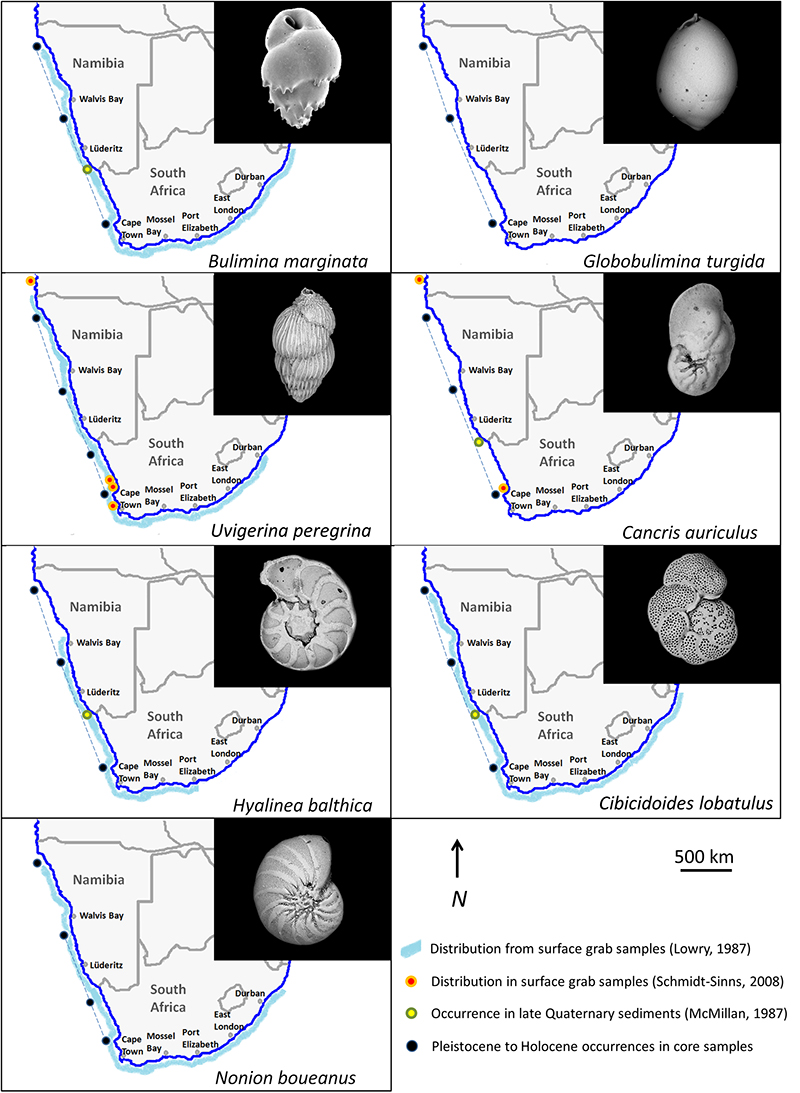
FIGURE 14. Distribution maps of benthic foraminifera occurring in Namibian and western South African outer shelf (blue shading = Lowry, 1987; black dots = Compton et al., 2002, 2004 and this study), lower to middle upper Quaternary sediments (green-yellow dots = McMillan, 1987) and inner shelf surface grab sediments (red-yellow dots = Schmidt-Sinns, 2008). Samples from McMillan (1987), Compton et al. (2002, 2004) and this study represent Pleistocene-aged foraminifera and samples from Lowry (1987) and Schmidt-Sinns (2008) are from surface grab sediments.
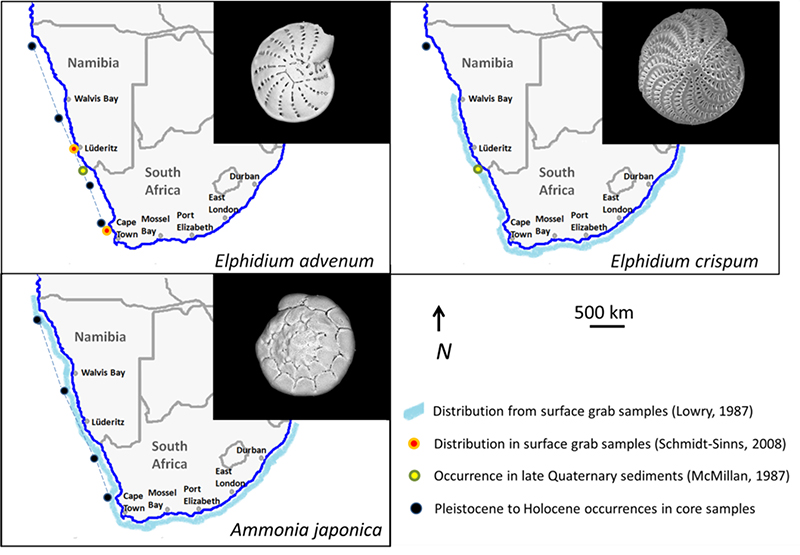
FIGURE 15. Mid to late Pleistocene/Holocene environmental interpretation of the southwestern margin of Africa based on foraminifera and mollusc species found in outer shelf sediments. Slope data and occurrences are based on reports from ODP Leg 175 (Wefer et al., 1998) and results from cores GeoB 20601-4, 8342-6 and 8336-6 (Meteor Cruises M123 and M57/1) in Chapter 7 of Bergh (2019).
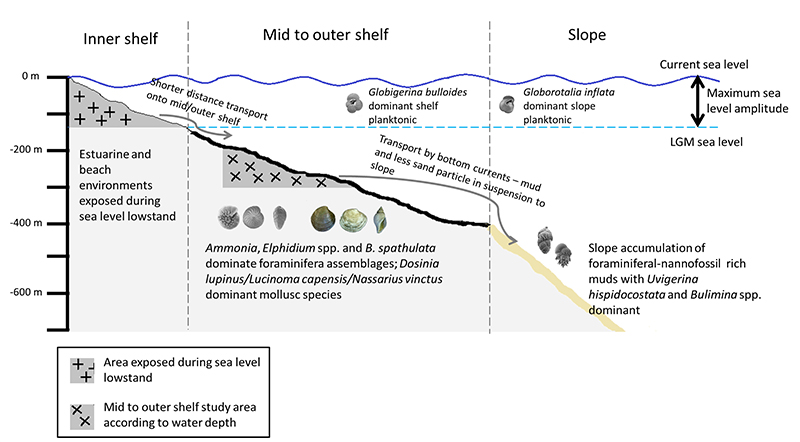
FIGURE 16. Infaunal-epifaunal abundances expressed as relative abundances (%) and in number of species.
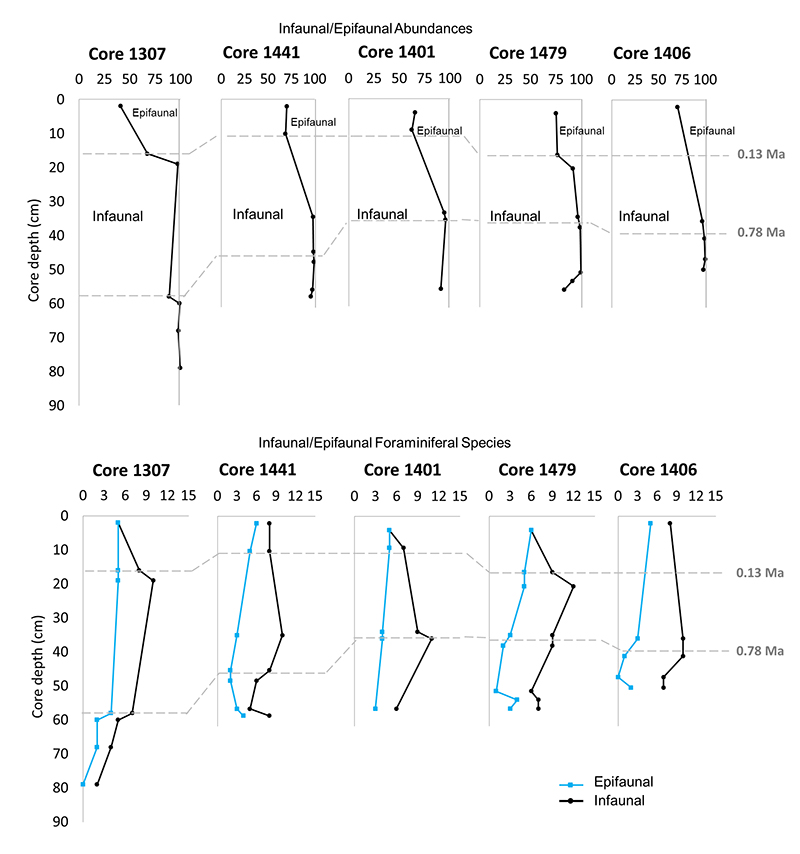
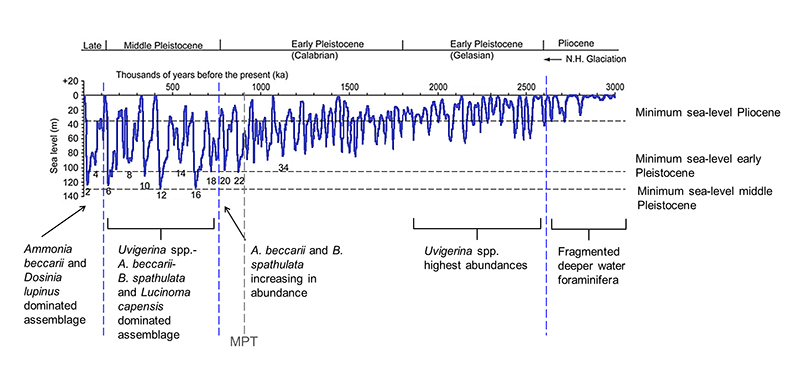
FIGURE 17. Global range in sea level (Bintanja and van de Wal, 2008) since 3 Ma in relation to the foraminiferal and mollusc assemblages preserved in sediments of the study area. MPT = Mid-Pleistocene transition.