FIGURE 1. Location of A, Late Pleistocene deposit of Is Mesas and B, Sa Mesa Longa Beach, Sardinia, Italy.
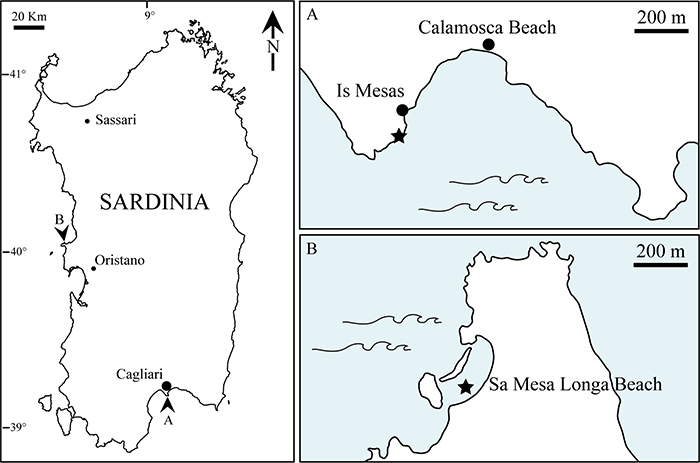
FIGURE 2. A, Field view of the Upper Pleistocene deposit of Is Mesas. B, Stratigraphic section of the deposit.
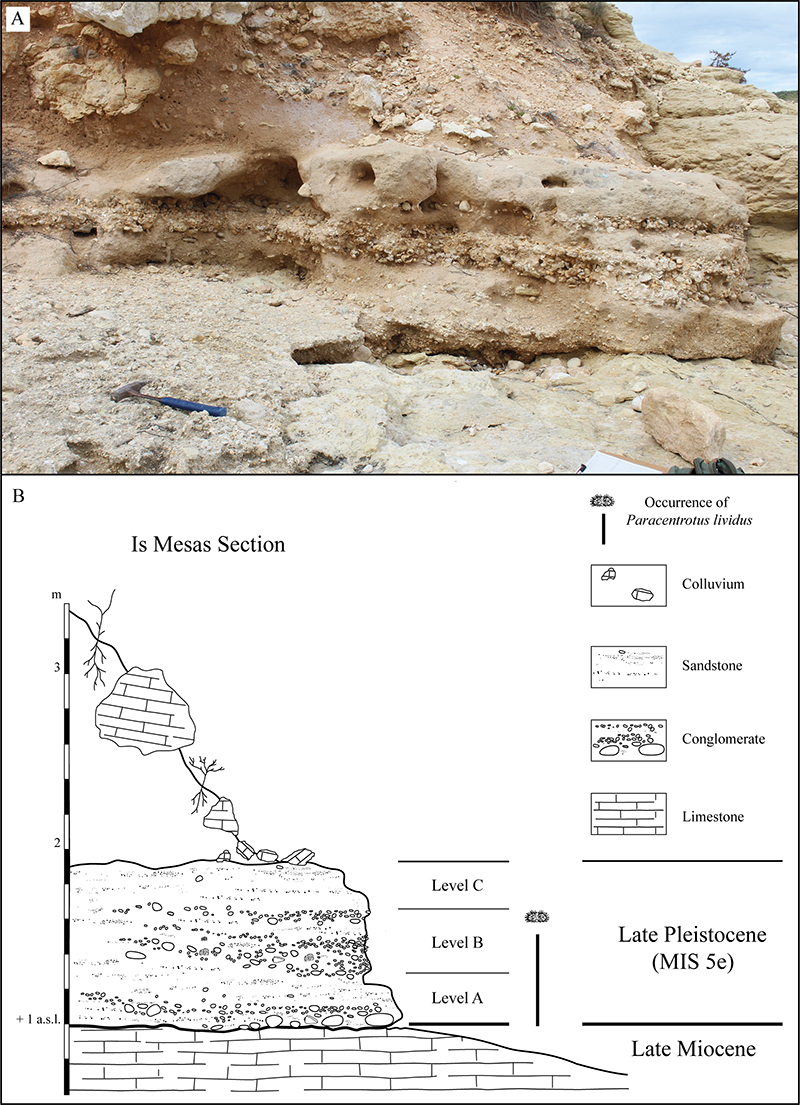
FIGURE 3. Remains of Paracentrotus lividus from Level A of the Is Mesas deposit (Late Pleistocene). A, 1) Fragment of test consisting of ambulacral and interambulacral plates still sutured together and showing interplate fracturing; 2) Isolated plates; 3) Fragments; 4) Spines. B, Large portion of ambulacral column showing intraplate fragmentation. C, Large portion of interambulacral column. D, Fragmented interambulacral plate. E, Madreporite. F, Hemipyramid. G, Rotula. H, Complete spine. A-C, H Scale bars equal 1 cm. E-G Scale bars equal 0.5 cm.
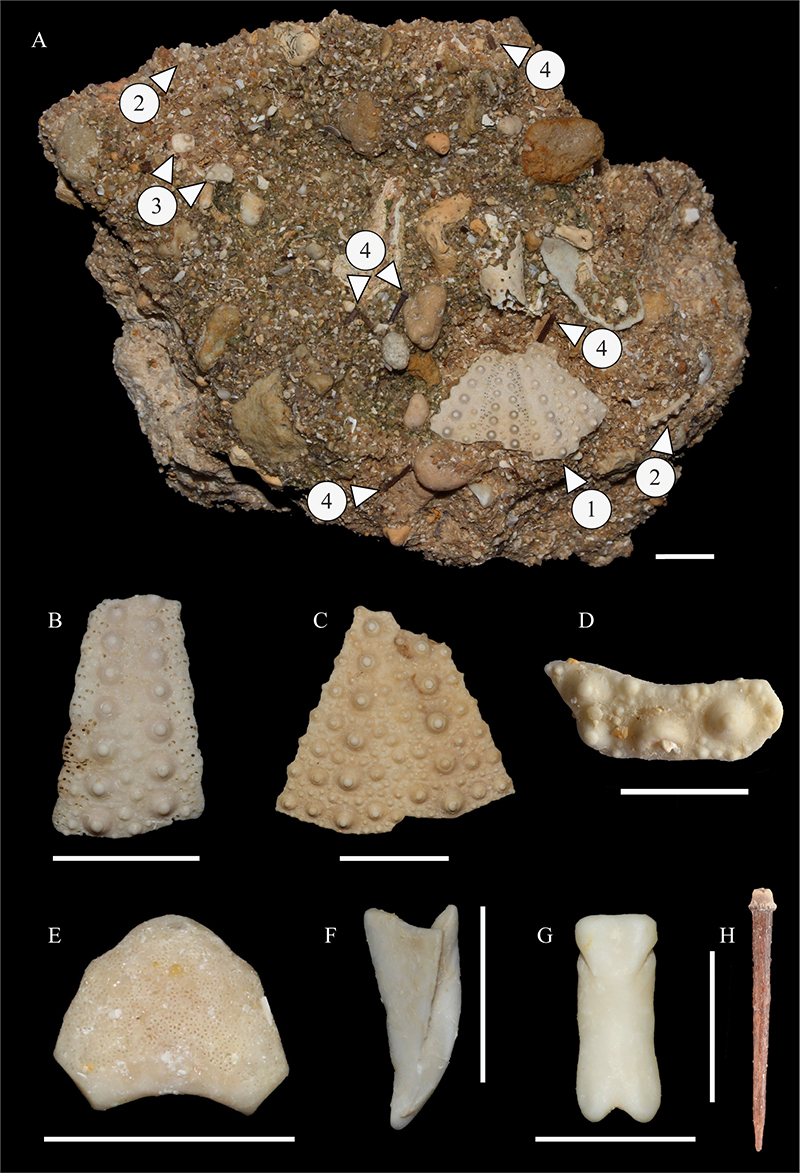
FIGURE 4. Associated fauna from levels A and B of the Is Mesas deposit (Late Pleistocene). A, Patella caerulea. B, Diodora gibberula. C, Cerithium vulgatum. D, Hexaplex trunculus. E, Melarhaphe neritoides. F, Acanthocardia tuberculata. G, Irus irus. H, Arca noae. I, Cardita calyculata. J, Cladocora caespitosa. Scale bars equal 1 cm.
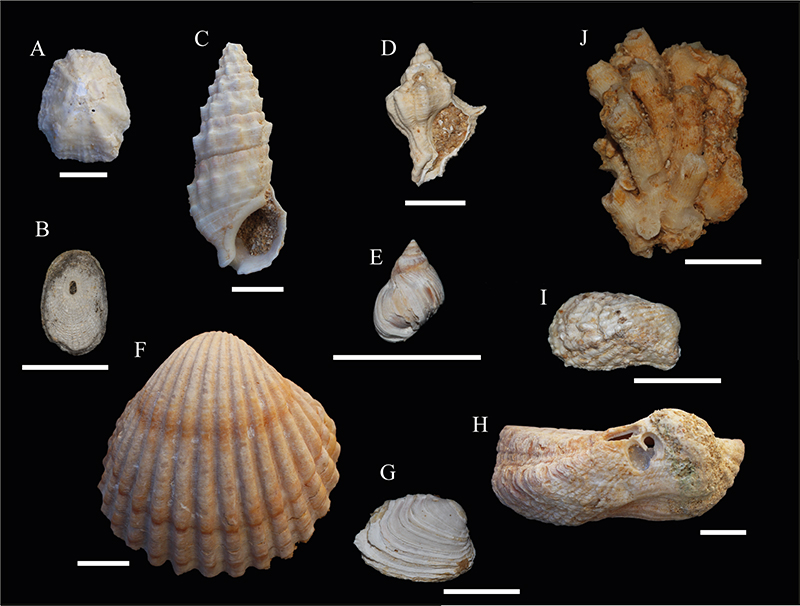
FIGURE 5. Scanning electron micrographs of Paracentrotus remains from Is Mesas. A, Details of an ambulacral column affected by abrasion. B, Two ambulacral plates still sutured together. C, Interambulacral plate showing a cavity possibly related to bioerosion. D, Spine fragment showing fine surface details such as the crenulated milled ring and shaft striation. Scale bars equal 1 mm.
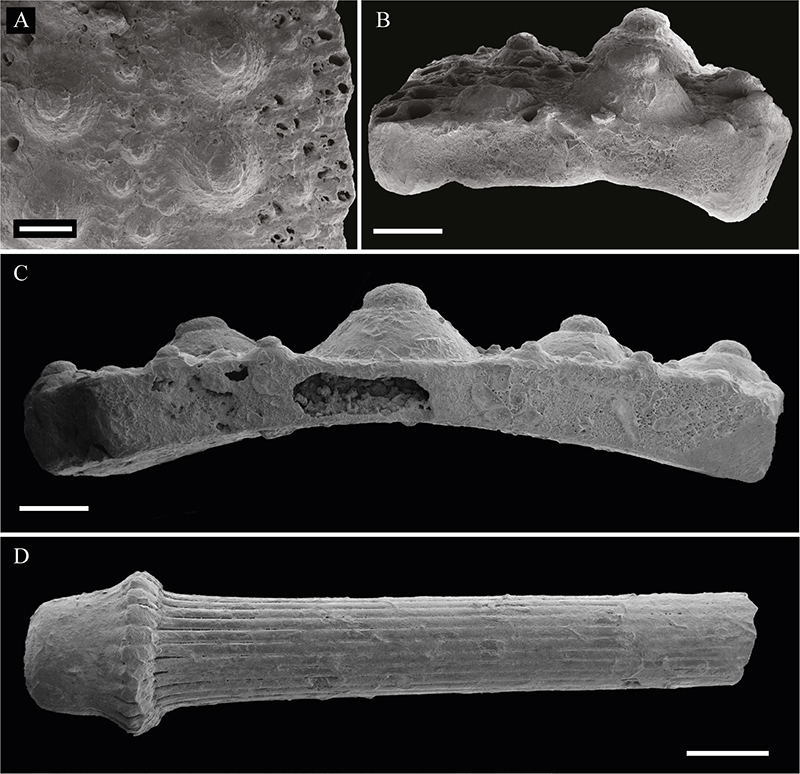
FIGURE 6. A, Panoramic view of Sa Mesa Longa Beach (Central-western Sardinia). B-H, Recent remains of Paracentrotus lividus from Sa Mesa Longa. B, Complete denuded test showing encrustation by serpulids. C, Test fragment made up of several ambulacral and interambulacral plates sutured together, showing inter- and intraplate fragmentation and encrustation by coralline algae and the polychaete Spirorbis. D, Internal view of a large test fragment affected by intraplate fragmentation and encrustation by serpulid worms. E, Two interambulacral plates showing abrasion and encrustation by Spirorbis. F, Single ambulacral plates showing fragmentation (white arrow). G, Epiphysis from the jaw apparatus showing fragmentation and abrasion. H, Madreporite from the apical system affected by fragmentation (white arrow). I, Test fragment of Arbacia lixula showing intraplate fracturing. J, Complete test of Echinocyamus pusillus. B, C, D, I, J Scale bar equals 1 cm. E-H scale bars equal 0.5 cm.
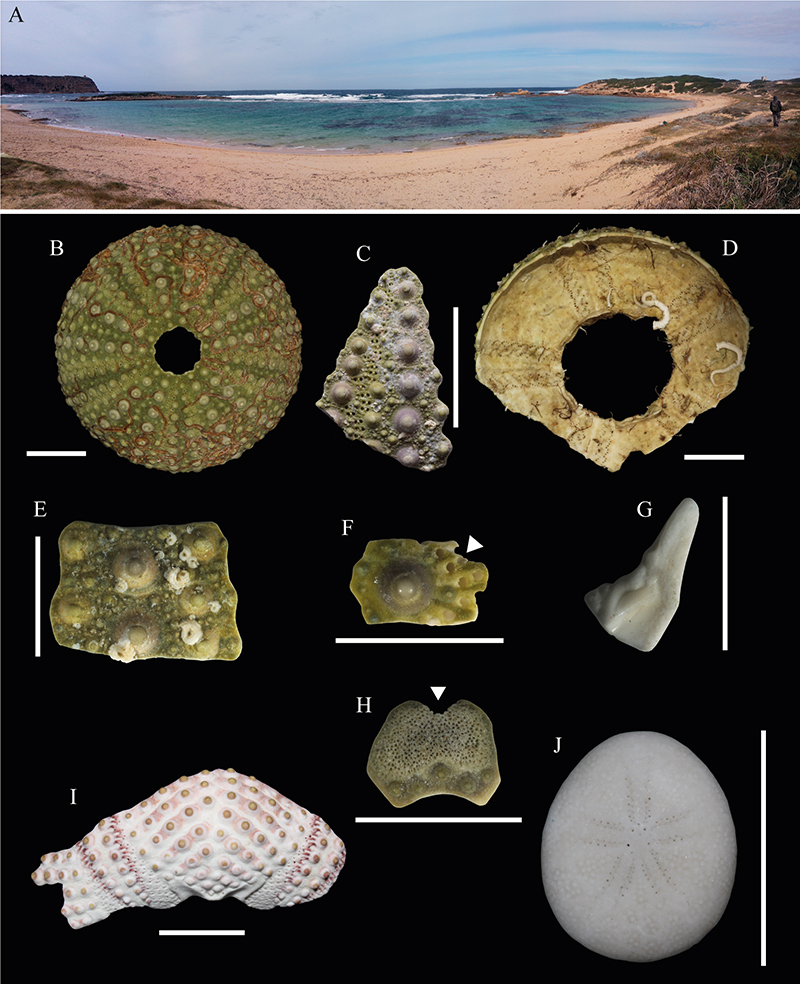
FIGURE 7. Scanning electron micrographs of suture faces in recent Paracentrotus lividus. A, Interradial suture between interambulacral plates showing galleried stereom with galleries running in aboral-oral direction. A1, Detail of the galleried stereom and collagen fibers. B, Adradial suture of interambulacral plates showing galleried stereom. B1, Detail of the parallel galleries and collagen fibers. C, Adapical suture of an interambulacral plates showing knob-like trabecular protrusions and cavities. C1, The close-up shows numerous knob-like protrusions some of which are interconnected to one another in twos, threes or more. D, Adoral suture of ambulacral plates; 1) Radial ridge at the boundary between ambulacral plates (running across perradial sutures) and 2) galleried stereom. A, B, C Scale bars equal 100 µm; A1, B1, C1 Scale bars equal 20 µm. D Scale bar equals 1 mm.
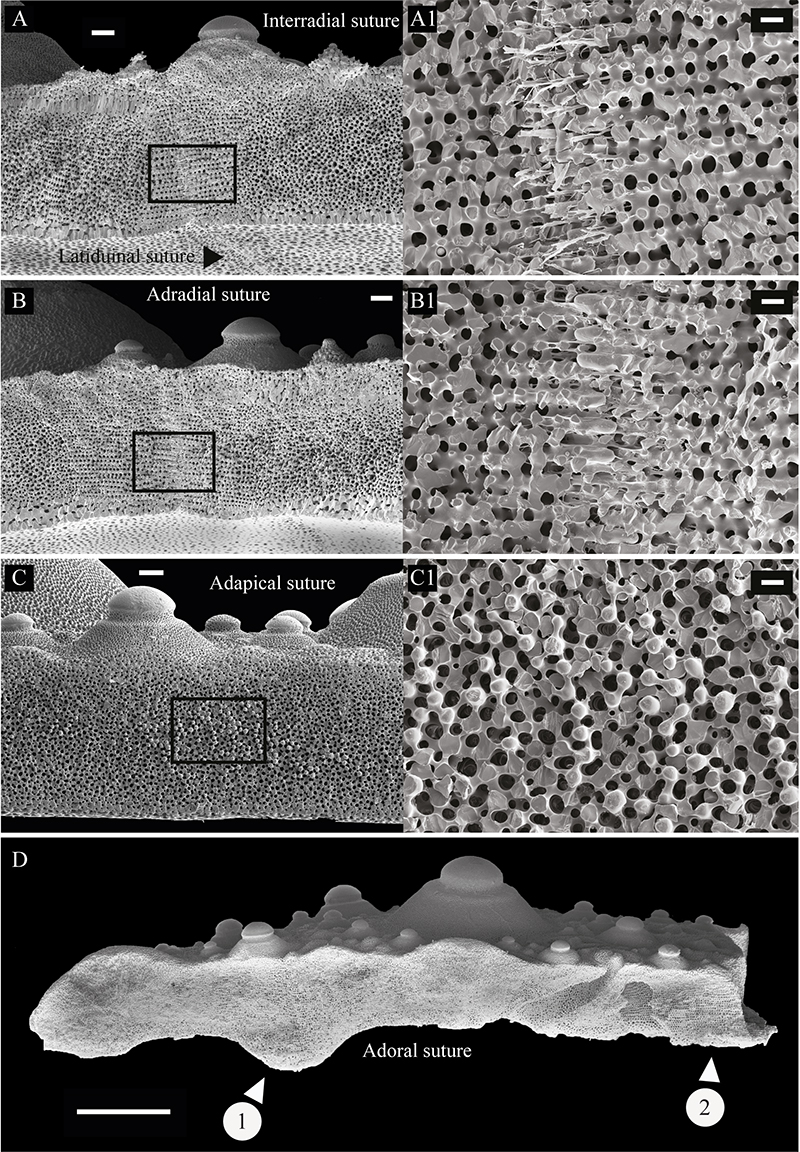
FIGURE 8. Size-frequency distribution of the rotulae of the Aristotle’s lantern both in Pleistocene deposit and recent setting. Each box-plot represents 25 and 75 percent quartile of all values, Q1 and Q3 respectively. Black line inside the box represents the median. Whiskers are drawn from Q1 and Q3 to the largest values less than 1.5 times the Interquartile range (Q1-Q3). N = number of counted specimens.
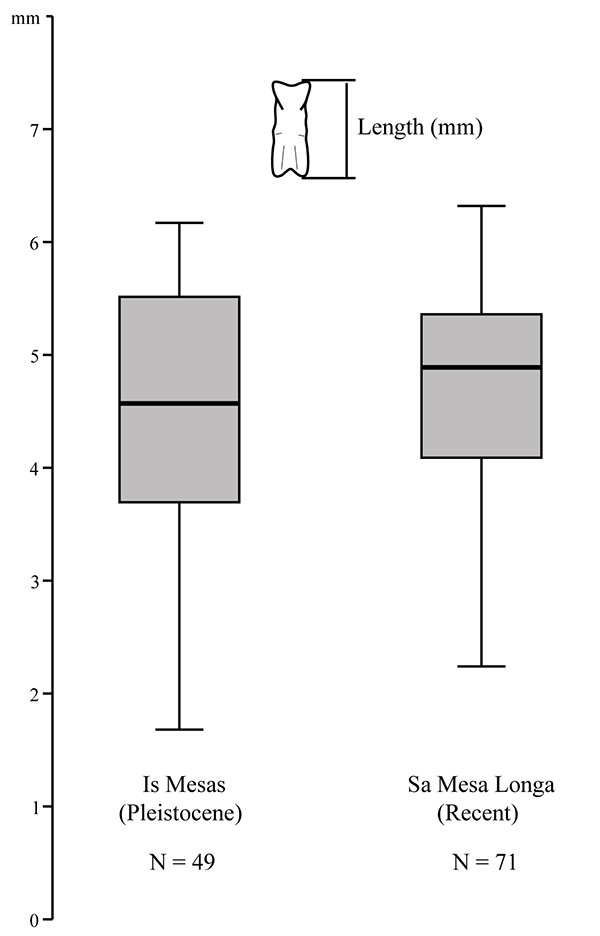
FIGURE 9. Relative abundance of Paracentrotus lividus test remains. A, Is Mesas (Pleistocene-Bulk sample). B, Sa Mesa Longa Beach (Recent-Surface collection). C, Sa Mesa Longa Beach (Bulk sample). N = number of counted specimens.
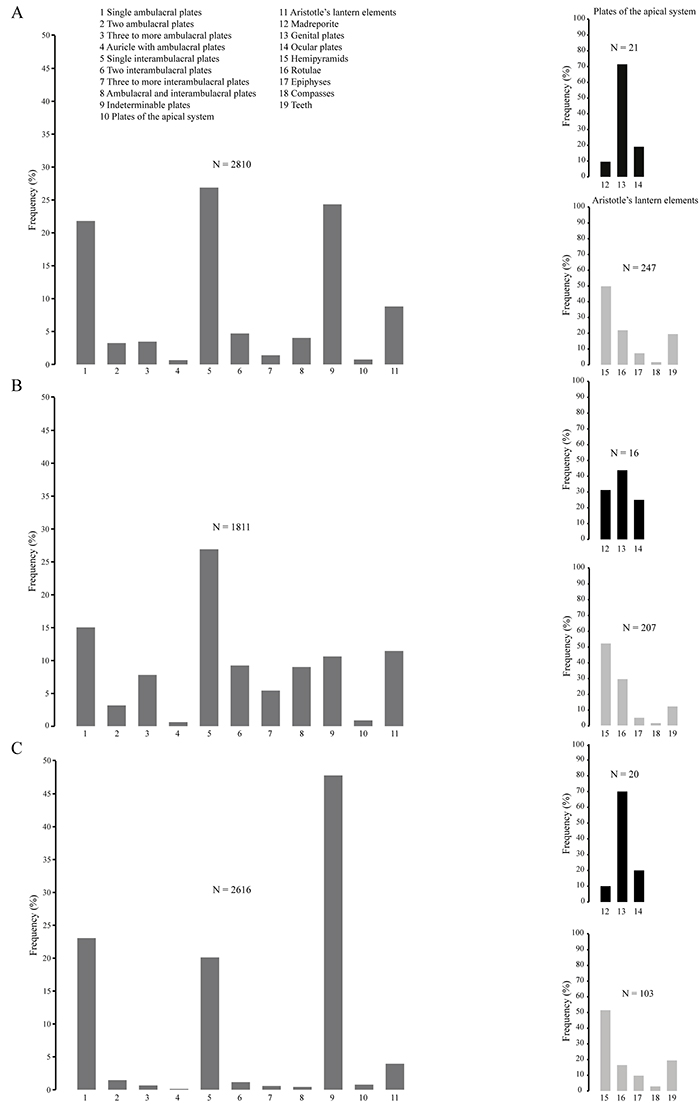
FIGURE 10. Biostratinomic signatures (fragmentation, abrasion and encrustation) of echinoid test remains. A, Is Mesas (Pleistocene-Bulk sample). B, Sa Mesa Longa Beach (Recent-Surface collection). C, Sa Mesa Longa Beach (Recent-Bulk sample). N = number of counted specimens. Numbers (1-11) are explained in Figure 9. Colors: dark grey, light grey and black represent fragmentation, abrasion and encrustation, respectively.
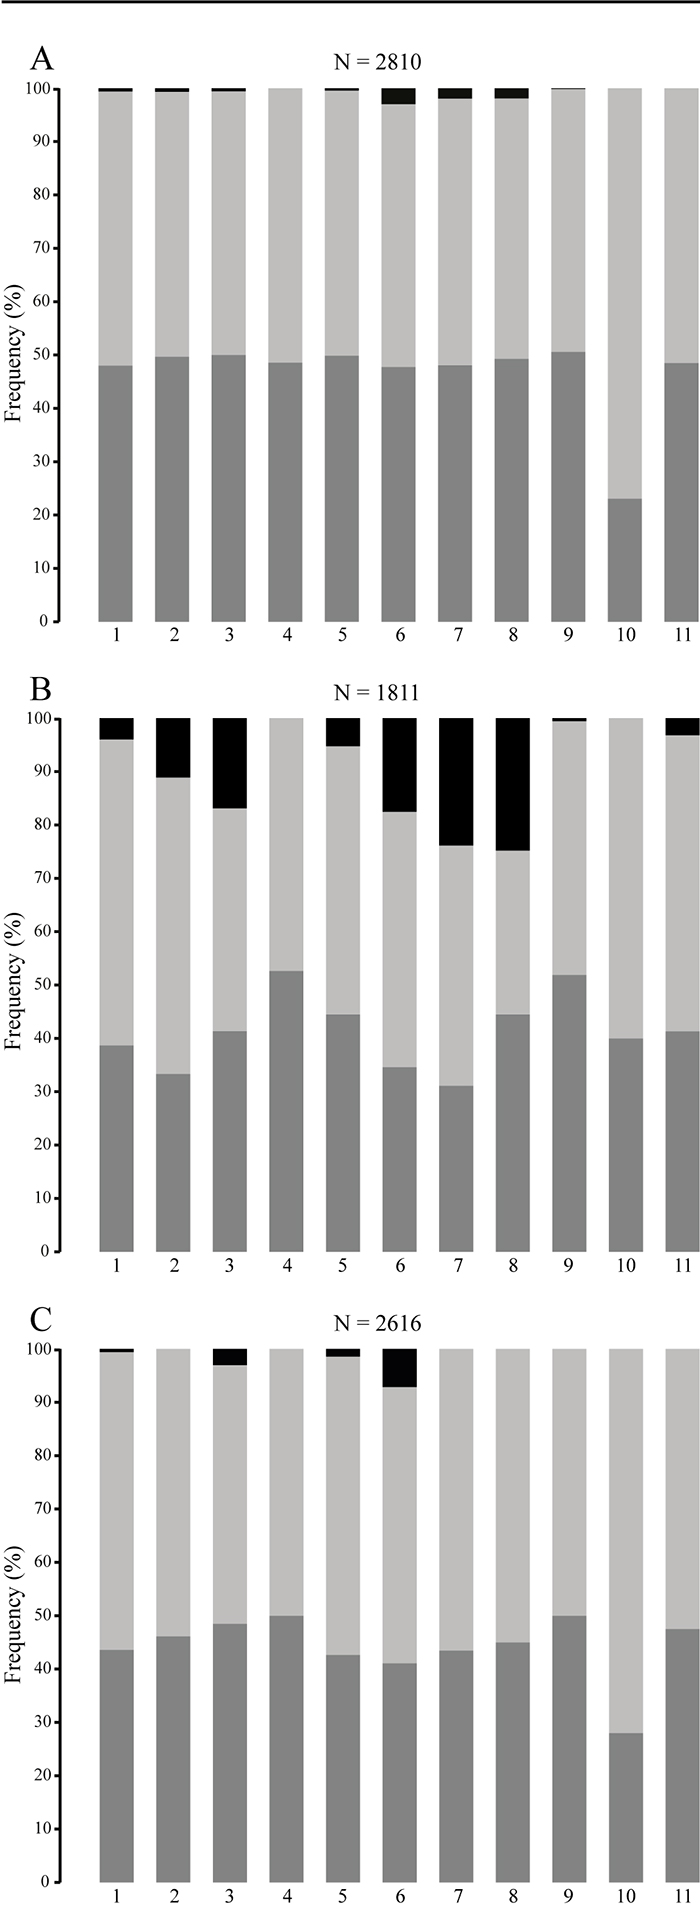
FIGURE 11. Distribution of ambulacral and interambulacral plates in the two sediment fractions (> 2 mm and 1-2 mm) investigated herein. N = number of counted specimens.
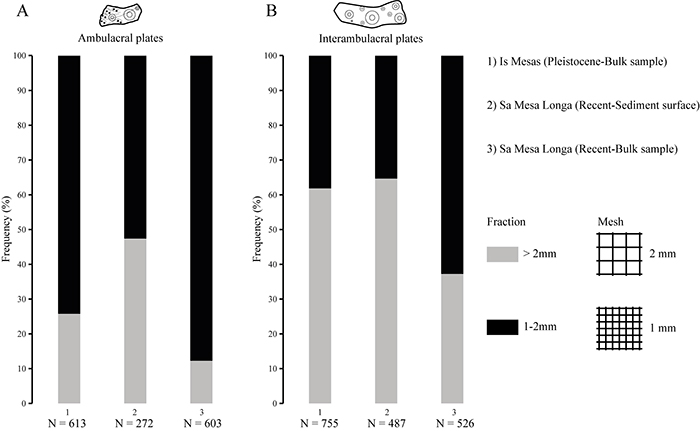
FIGURE 12. Relative abundance of Paracentrotus lividus spine remains. A, Is Mesas (Pleistocene-Bulk sample). B, Sa Mesa Longa Beach (Recent-Surface collection). C, Sa Mesa Longa Beach (Bulk sample). N = number of counted specimens.
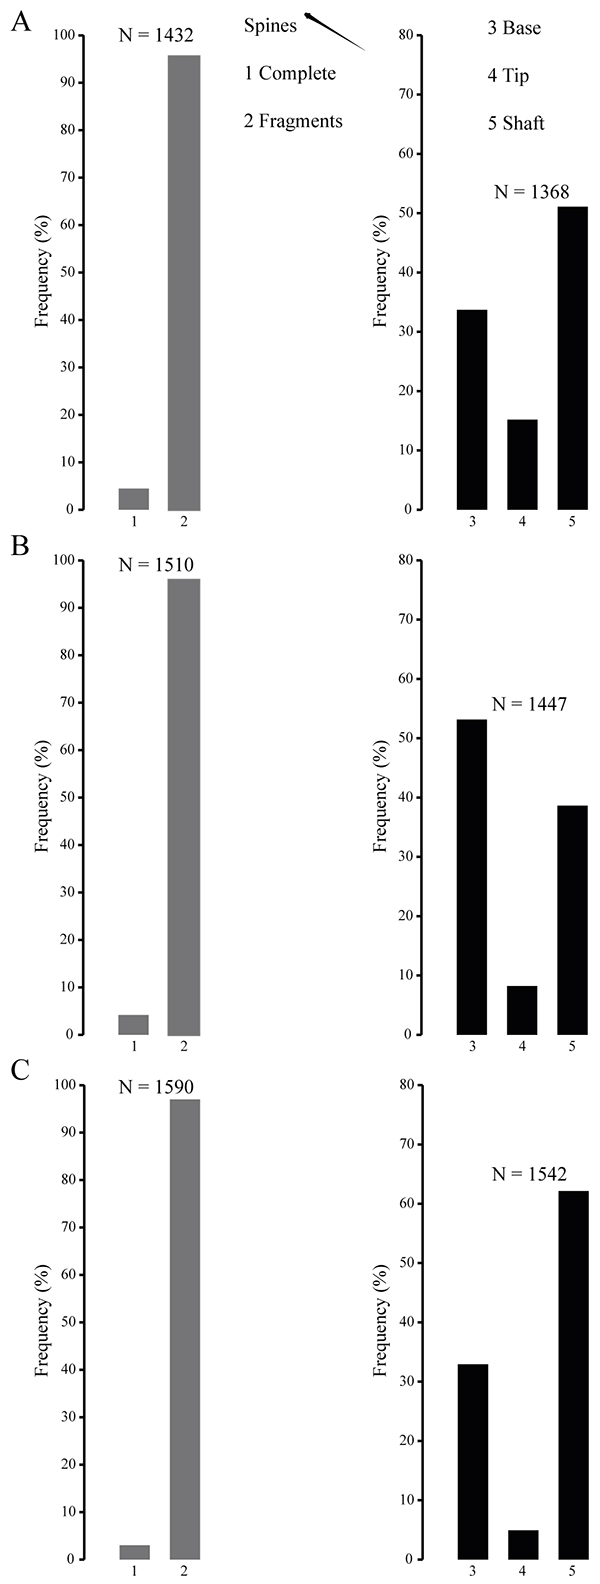
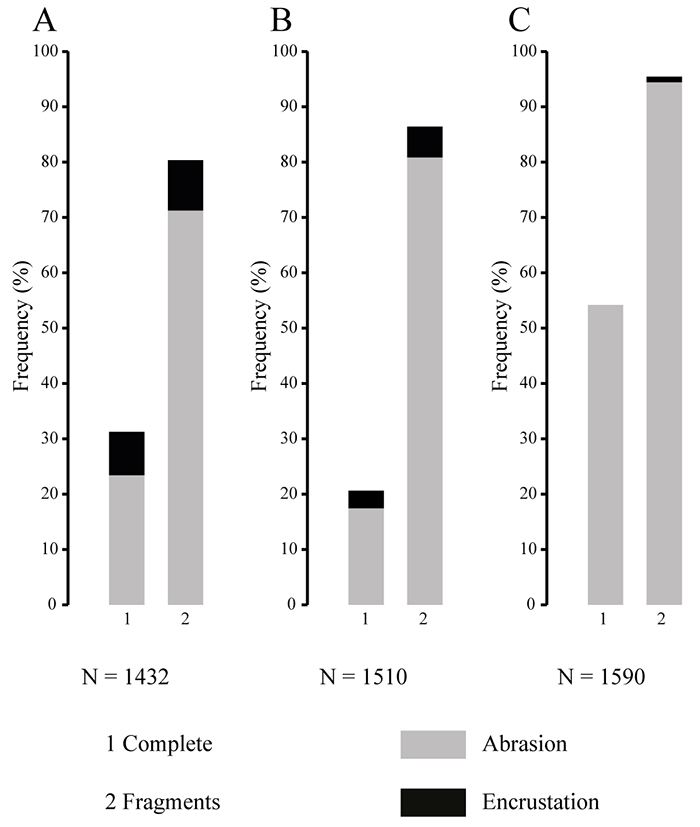
FIGURE 13. Biostratinomic signatures (abrasion and encrustation) of spine remains. A, Is Mesas (Pleistocene-Bulk sample). B, Sa Mesa Longa Beach (Recent-Surface collection). C, Sa Mesa Longa Beach (Recent-Bulk sample). N = number of counted specimens.