FIGURE 1. Accretionary growth (blue line) as an outline (A), and as a graph of loge (radius, r) against angle, θ, about an axis (cross symbol) (B). The intercept is the loge(radius) when θ = 0, and the constant slope defines the expansion of the L1 spiral.
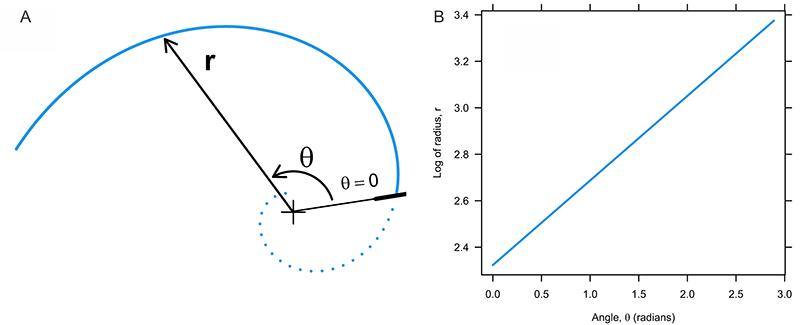
FIGURE 2. Eleven spirals that are more complex than the simple logarithmic spiral, L1 of Figure 1. Outlines are plotted on a logarithmic scale for radius against angle turned about the axis. Vertical lines show spirals with abrupt change, and shaded areas show regions of transitional change between log-piecewise spirals representing accretionary growth (see text for explanation and abbreviations).
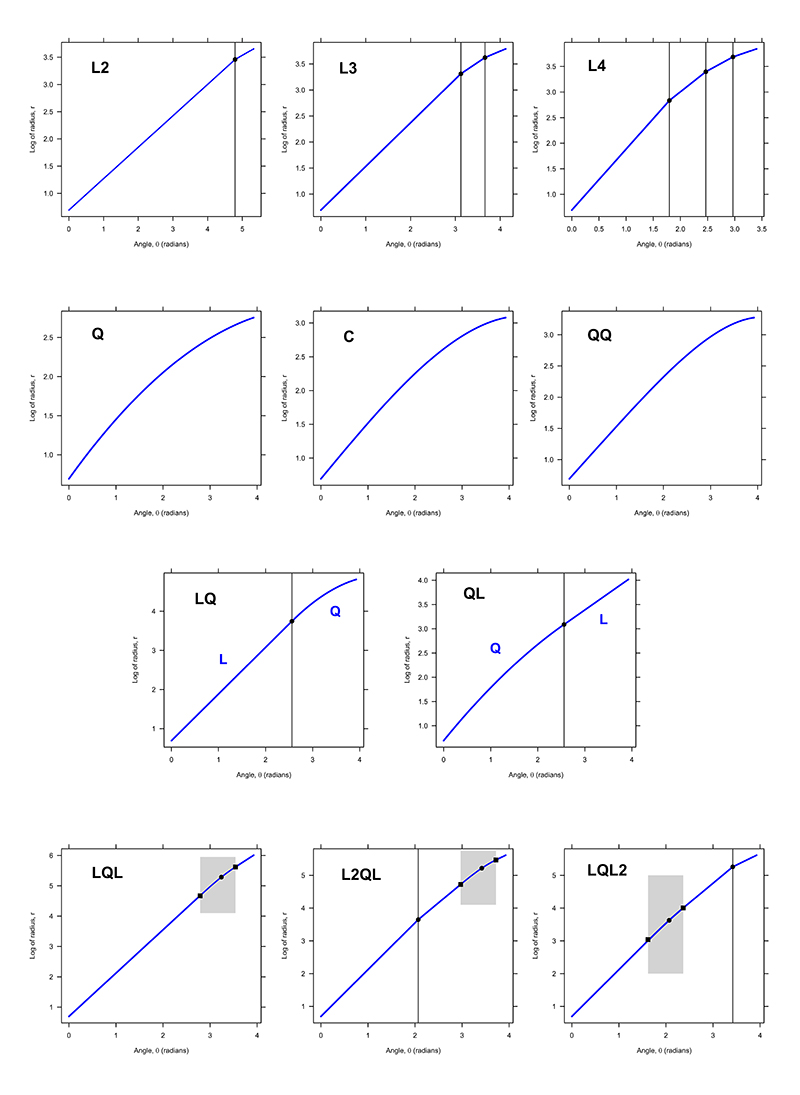
FIGURE 3. Sagittal section outline of the brachiopod LR-F1 (Pérez-Huerta et al., 2014, figure 2A). Ventral valve is the lower line (blue) turning anticlockwise, comprising 300 equally spaced points. Scale is in mm.
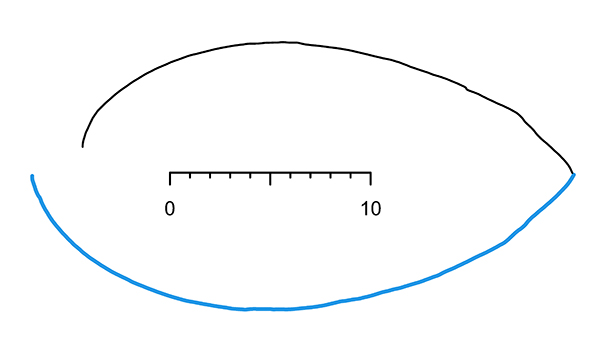
FIGURE 4. Nearest nine spirals to the LR-F1ventral valve outline, as ranked by similarity ratio on both local and global features. Spirals along axes are in approximate order of complexity. The green line represents agreement between local and global features.
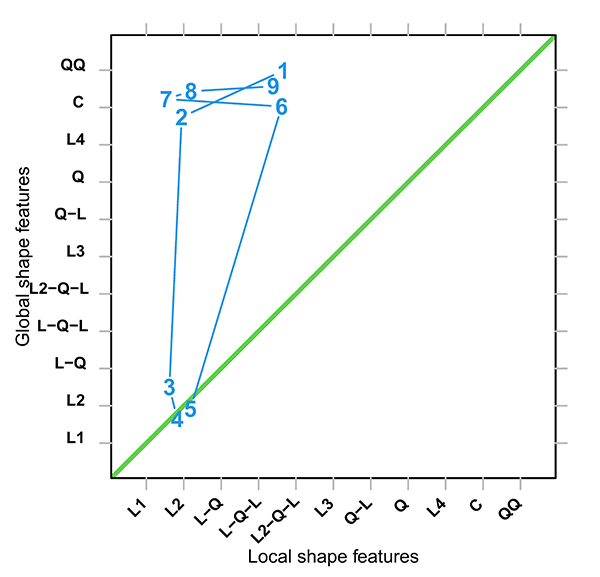
FIGURE 5. Reducing then increasing error (residual standard deviation) for different spirals fitted to the LR-F1 ventral valve. Absolute least error is not always the best spiral. See text for abbreviations and explanation.
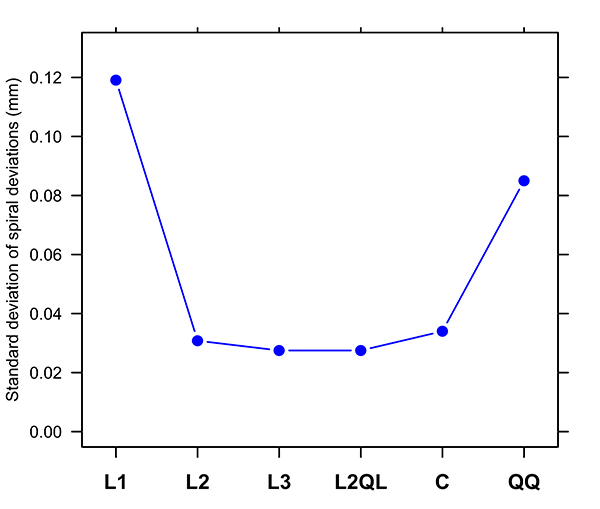
FIGURE 6. Patterns of spiral deviations with accretionary growth (arc length) for four spirals. Apart from the L1 spiral, deviation patterns are similar and have the same vertical scale. Vertical lines and shade (red) locate estimates of where changes in spiral shape occur on the outline.
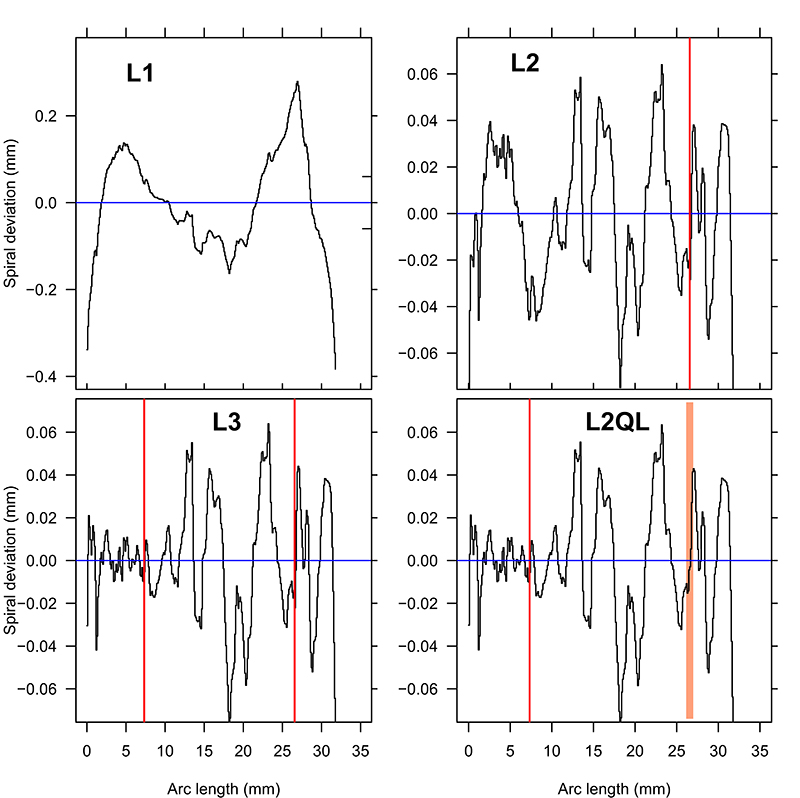
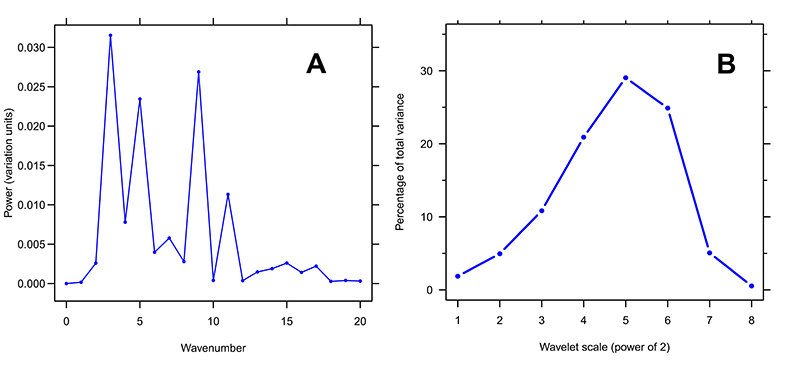
FIGURE 7. Fourier spectrum of spiral deviations from the L2 fit of the LR-F1 ventral (A). Wavelet scalogram of the same spiral deviations (B). See text for explanation.