FIGURE 1. Original line drawings and SEM images of Difflugia proteiformis (Penard, 1902). Scale bar equals 100 µm. 1.1, Reproduction of original line drawing of D. proteiformis from Lamarck, 1816. 1.2, D. proteiformis from lake near Yellowknife, NWT, Canada. 1.3, D. proteiformis from Bell’s Lake, ON, Canada.
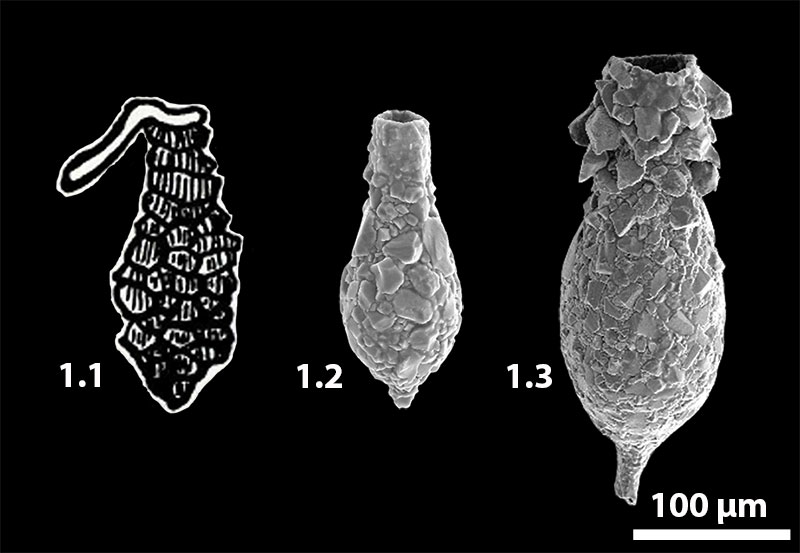
FIGURE 2. SEM images of Erugomicula bidens showing typical morphology; images 2.1-2.4 are all relative to a 100 µm scale bar. 2.1, Original drawing of E. bidens reproduced from Penard, 1902. This specimen has been designated herein as the lectotype for E. bidens (Penard 1902). 2.2, Apertural view of E. bidens showing circular aperture and lateral compression. 2.3, E. bidens showing ovoid shape and three spines in a slightly angled face view. 2.4, Oblique view of E. bidens specimen showing lateral compression from side view. 2.5, E. bidens specimen showing slightly raised collar around aperture. Scale bar equals 250 µm. 2.6, Enlarged view of E. bidens collar. Scale bar equals 100 µm. 2.7, Broken basal process from a E. bidens specimen showing that these processes are hollow. Scale bar equals 20 µm.
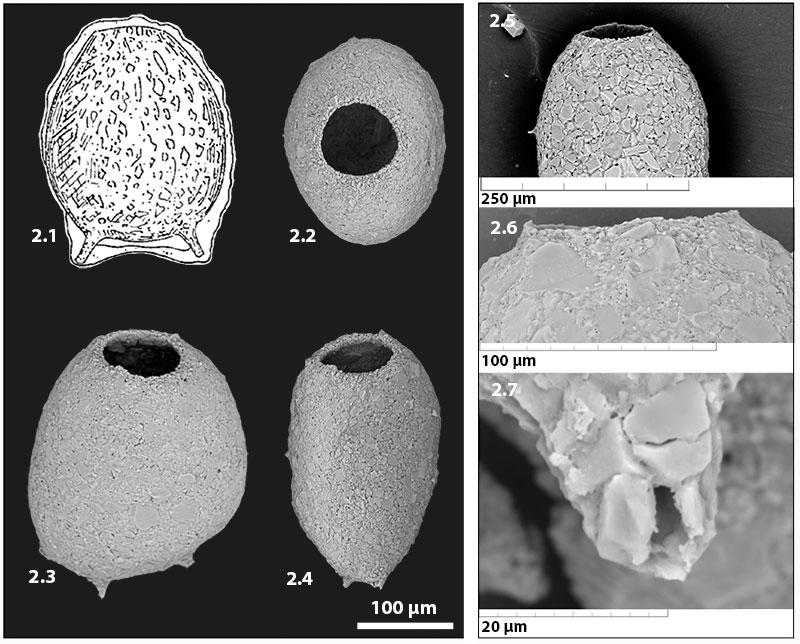
FIGURE 3. SEM images of Erugomicula bidens specimens from Bell’s Lake, ON, Canada, showing morphological variability. Scale bar equals 100 µm. 3.1-3.3, A series of E. bidens specimens displaying the varying number of basal processes typical of the species. The number of basal processes present, including specimens with no processes present is highly variable, although morphologies with two basal processes are most common. When present the basal processes are arranged along the fundus. 3.4-3.6, A series of E. bidens specimens in side view demonstrating variations in the length-to-width ratio.
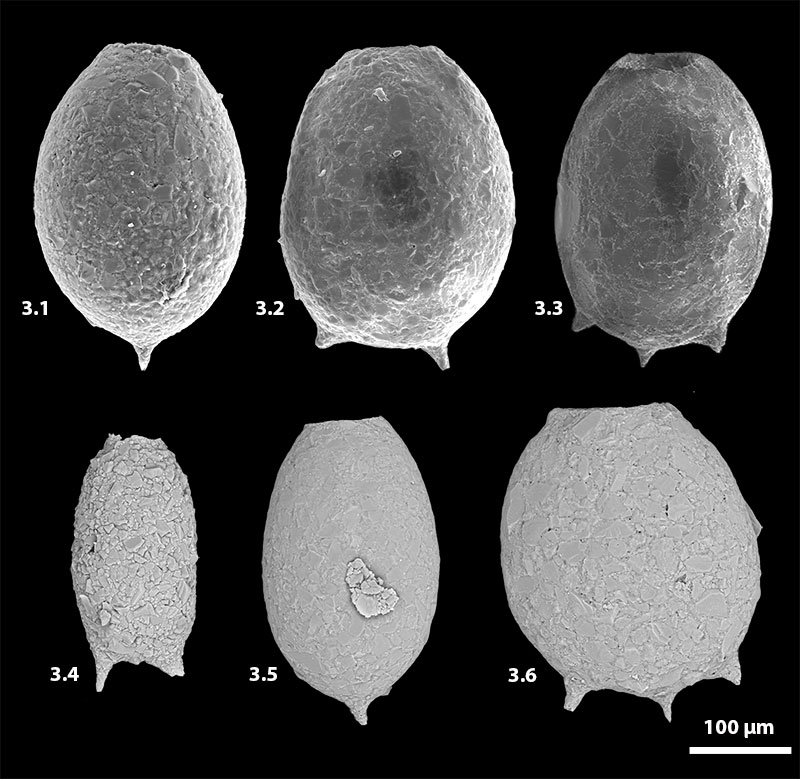
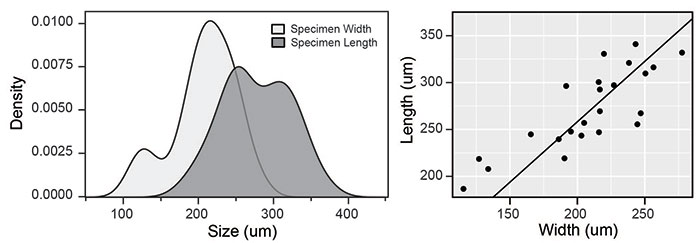
FIGURE 4. Morphological parameters of Erugomicula bidens measured using specimens retrieved from Bell’s Lake (ON) Scott’s Pond (ON) and Yellowknife (NT) (n=24). Left, Density distribution plot of length and width of E. bidens; specimen width is represented by the light grey curve, and specimen length with the dark grey curve. Right, Scatterplot of length versus width of measured E. bidens specimens; the black line represents the median length:width ratio of 1.3.