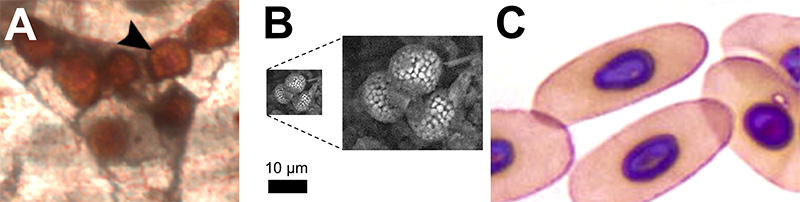
FIGURE 1. Cells and soft tissues from bones of the hadrosaurid dinosaur Edmontosaurus annectens, from the Standing Rock Hadrosaur Site (SHRS) in South Dakota (Upper Cretaceous: Maastrichtian). The images are reprinted from figure 2 of Cretaceous Research vol. 99, Ullmann et al., “Patterns of soft tissue and cellular preservation in relation to fossil bone tissue structure and overburden depth at the Standing Rock Hadrosaur Site, Maastrichtian Hell Creek Formation, South Dakota, USA” (2019), with permission from Elsevier. A. Osteocyte from fragment of ossified tendon. B. Osteocyte from caudal vertebra SRHS-DU-220. C. Blood vessels with spherical structures in the lumen, from metatarsal SHRS-DU-274. D. Blood vessel (right) and sheets of CBM (lower left) from fragment of ossified tendon. E. Sheet of CBM with embedded osteocytes, from metatarsal SHRS-DU-274.
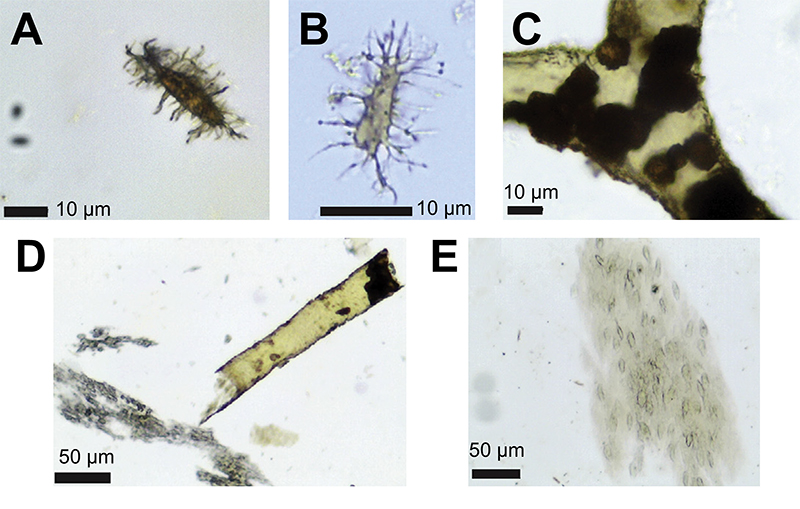
FIGURE 2. Microstructure of bone matrix. A. Part of a collagen molecule, showing its triple helical structure (based on figure 2 of Bella (2016), with modifications), with each of the three helices shown in a different color: black, dark gray, and light gray. B. A collagen microfibril and associated bone mineral crystallites, showing that the microfibril consists of five staggered collagen molecules and that the crystallites form between the tips of the collagen molecules in the microfibrils (based on figure 1d of Alexander et al. (2012), with modifications). C. Part of a collagen fibril, showing that bone mineral crystallites form both within microfibrils (unshaded crystallites) and between microfibrils (shaded crystallites).
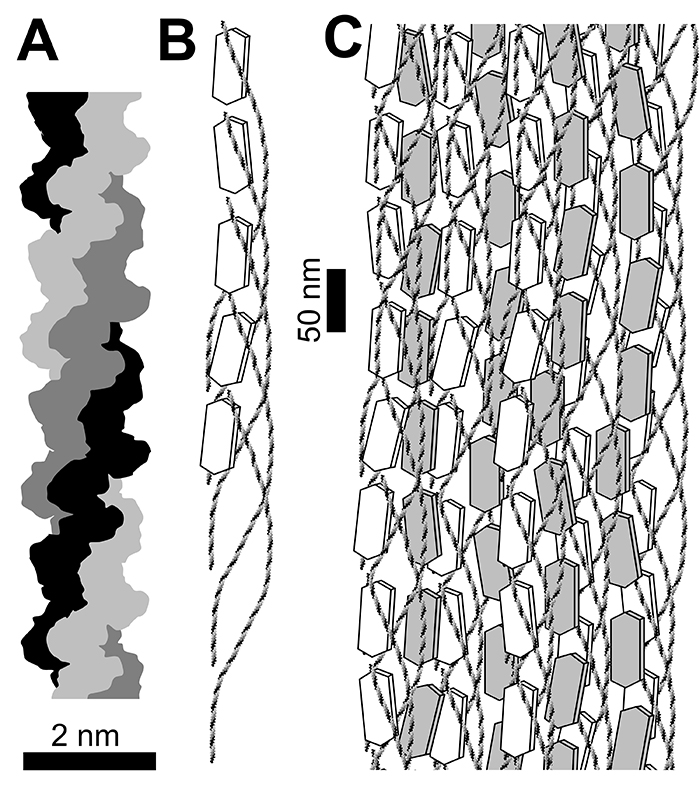
FIGURE 3. Histology of bone. A. Macroscopic view of compact and spongy bone in a cross-section of the humerus of a domestic cow (Bos taurus). B. Arrangement of microstructures in compact and spongy bone. C. Human compact bone viewed through a compound microscope, with cells boiled away and voids filled with black ink, to make lacunae and canaliculi stand out.
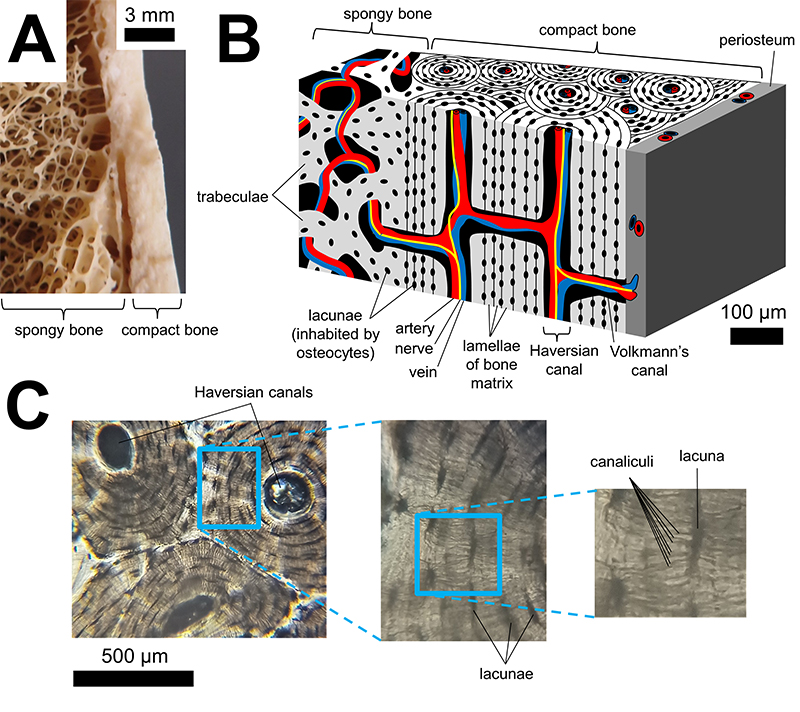
FIGURE 4. The geologic column according to science vs. YEC ideology. Time periods are not shown to scale. The dates according to science are from radiometric dating (Schmitz, 2020). The dates according to YEC ideology are based on biblical genealogies (Jones, 2016). YEC identifications of Paleozoic, Mesozoic, and pre-Quaternary Cenozoic strata as Flood deposits (e.g., Clarey, 2020; Oard and Carter, 2021) are based on misinterpretations of geologic data (Senter, 2011; Willoughby, 2016; Prothero, 2017; Senter, 2019).
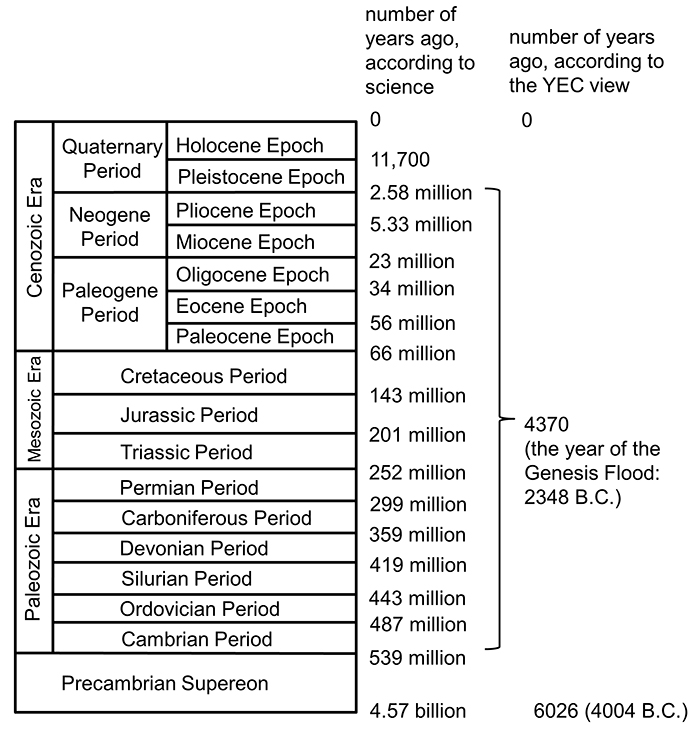
FIGURE 5. Simplified overview of factors that influence the preservation and destruction of the cellular, soft tissue, and mineral content of bone. Diagenesis of these materials is more complex than is shown here. Additional factors also have influence, and multiple levels and modes of preservation and destruction may occur in different regions of a single bone (see text for details).
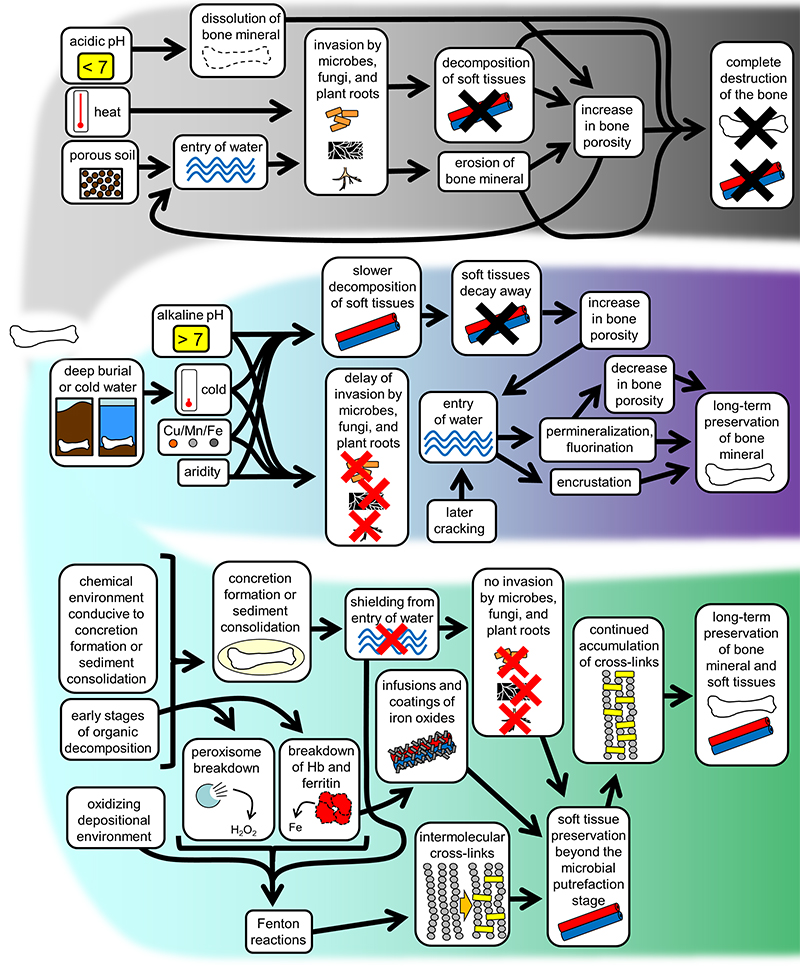
FIGURE 6. Recrystallization of bone mineral. Note that through geologic time, the crystallite has become enlarged, and many of its original ions have been replaced by other ions from groundwater. Here, ions are not shown to scale with respect to each other or to the size of the crystallite. For details on relative abundances of the various ions in fossil bone, see Hubert et al. (1996); Kiseleva et al. (2019); Ullman et al. (2021); Schroeter et al. (2022); and Ullmann et al. (2022). REE = rare earth elements.
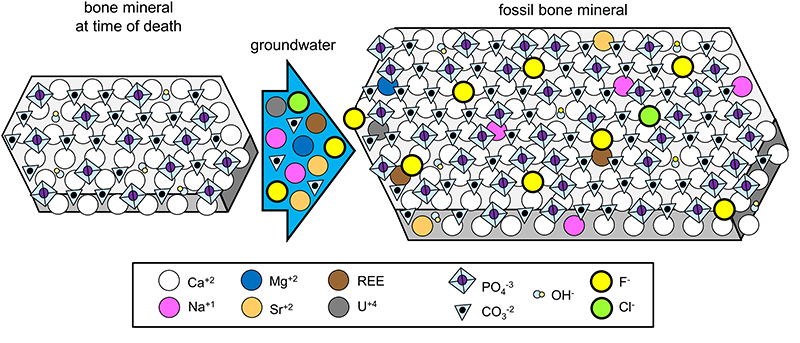
FIGURE 7. Spherical objects in a blood vessel from fossil bone, and items with which such structures have been hypothetically identified. The scale bar applies to A, C, and the smaller version of the image in B. The correct identity of the spherical objects in blood vessels of fossil bone remains unknown. A. Spherical objects in a blood vessel from fossil bone of the theropod dinosaur Beipiaosaurus inexpectus, from the Yixian Formation of Liaoning, China (Lower Cretaceous: Barremian-Aptian). This image is used with the permission of the journal PeerJ. It is from figure 2C of “Putative fossil blood cells reinterpreted as diagenetic structures,” PeerJ, vol. 9: e12651, Korneisel et al. (2019). B. Pyrite framboids, shown to scale with A and C (left) and enlarged (right). This image is used with the permission of the journal PALAIOS. It is from figure 1 of “Rapid formation of framboidal sulfides on bone surfaces from a simulated marine carcass fall,” PALAIOS, vol. 30: 327-334, Vietti et al. (2015). C. Red blood cells of the crocodilian species Caiman yacare (spectacled caiman). This image is reprinted by permission from Springer, from figure 1A of “ Hepatozoon caimani Carini, 1909 (Adeleina: Hepatozoidae) in wild population of Caiman yacare Daudin, 1801 (Crocodylia: Alligatoridae), Pantanal, Brazil,” Parasitology Research, vol. 116: 1907-1916 (2017).