FIGURE 1. A. An interval and its components; B. Possible relationships between two intervals and A, B, and C in the Character X's space; C. DBI’s behavior according to the possible relationships between the intervals of any two objects. For this, a mobile test interval of range X with its upper limit placed at Y was discreetly displaced by D units W times. For each of these W steps the DBI between the test interval and a fixed interval of range F with its lower limit placed at H were computed. The Left section shows the DBI for non-overlapped intervals; the Central section shows the DBI for partially overlapped intervals; and the Right section shows the DBI for fully overlapped intervals. Dashed lines show the results between intervals with different relative ranges (i.e., interval sizes). The asterisks show the paired distances between A, B, and C using DBI.
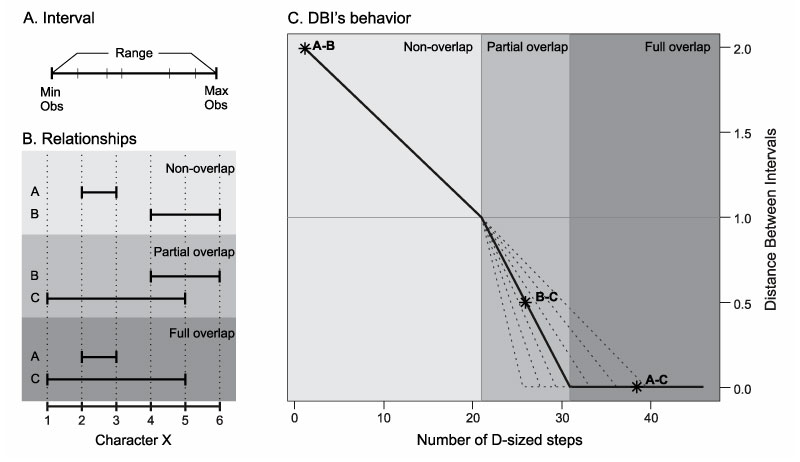
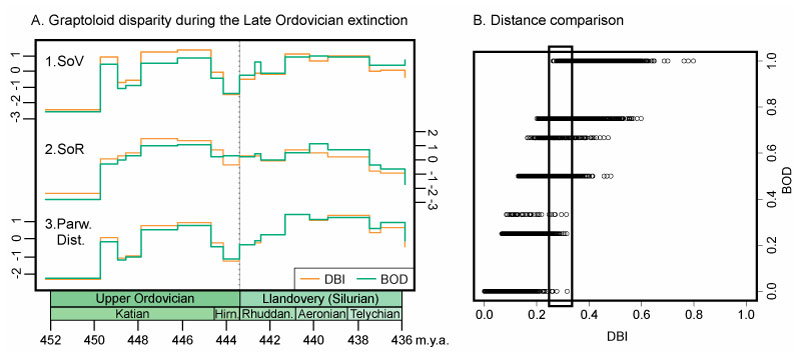
FIGURE 2. Comparing the DBI and the BOD with empiric data. A. Morphological diversity of graptolites through time across the Late Ordovician extinction: 1. Sum of variances from the PCoA; 2. Sum of ranges from the PCoA; 3. Mean of the raw pairwise distances. B. Comparison of paired distances using DBI and BOD. The rectangle shows the range of DBIs for which BOD shows its maximum variation.