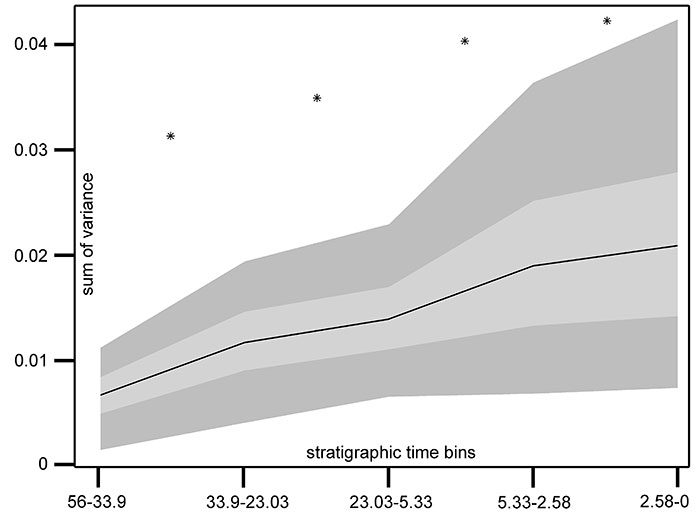
FIGURE 1. Different developmental stages of Carcinus maenas under fluorescent and natural light. Cyan-coloured circles mark position of first harmonic, used to align shapes. A: Lateral view of zoea under fluorescent light. B: Dorsal view of megalopa under fluorescent light (car_29G; Appendix 1). C: Dorsal view of juvenile under fluorescent light (car_2C; Appendix 1). D: Dorsal view of young adult under natural light (Oliver Mengedoht/Panzerwelten.de, Recklinghausen), source image did not contain a scale.
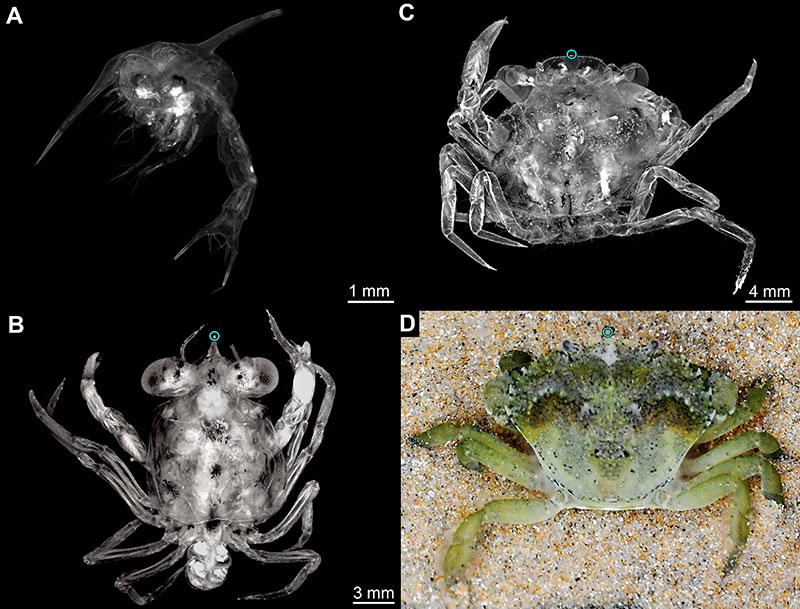
FIGURE 2. Scatter plot of the first two principal components from the PCA on the outline analysis of shields of Carcinidae. Grey outlines in the background describe shape variation across the morphospace.
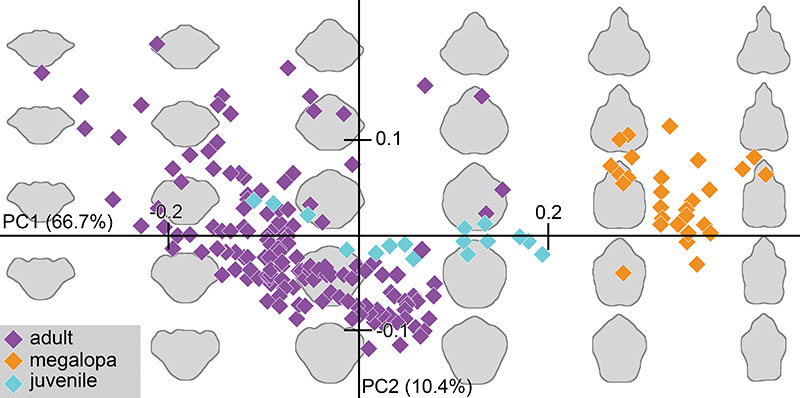
FIGURE 3. Phylogenetic tree of selected fossil and extant representatives of Carcinidae. Selected reconstructed shield outlines (based on PC1 and PC2 of outline analysis) based on ancestral state estimates are centred on the node they represent. Asterisks mark fossil species.
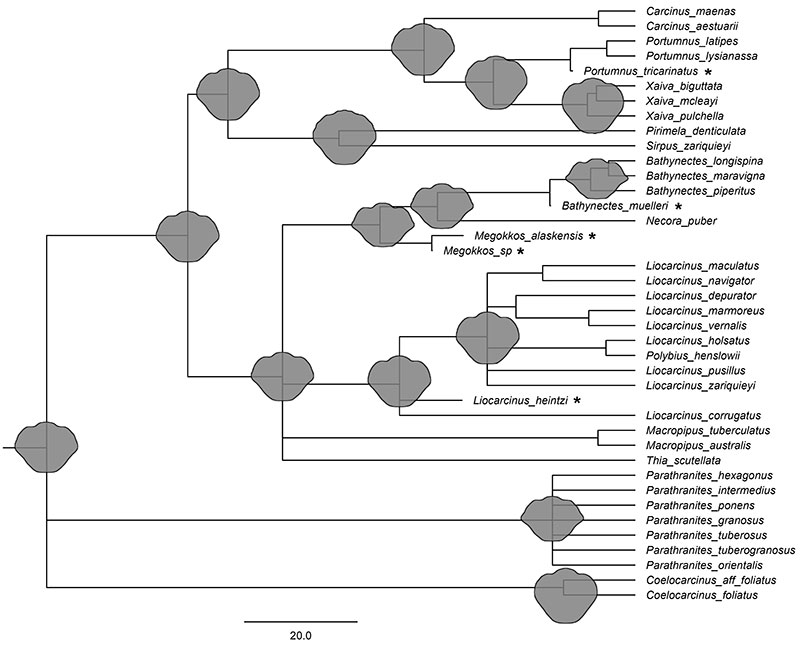
FIGURE 4. Analysis of morphological diversity changes through time. Black line represents mean, light grey and dark grey areas represent 50% and 95% confidence intervals, respectively. Sum of variances used as measure for morphological diversity on y-axis. Stratigraphic time bins in million years on x-axis, from left to right: Eocene, Oligocene, Miocene, Pliocene, Pleistocene including extant fauna. Ages following Cohen et al. (2023). Asterisks mark significant changes between time bins.