FIGURE 1. Cladogram of Blattodea phylogeny synthesized from eight previous studies (figure 2 in Maekawa et al., 2003; figure 4 in Klass and Meier, 2006; figure 1 in Inward et al., 2007; figure 3 in Pellens et al., 2007; figure 2 in Murienne, 2009; figure 2 in Djernæs et al., 2012; figure 3 in Djernæs et al., 2015; figures 4, 5, and 6 in Legendre et al., 2015). Support for a clade is represented by circles, each colored to indicate the studies in which that clade was recovered. Inward et al. (2007) and Pellens et al. (2007) do not report all support values for nodes on their trees so support from the topology of these studies may be over-represented here. The numbering next to Anaplectidae represents different possible positions of this group, or the potential that this group is polyphyletic. Legendre et al. (2015) supports Blattoidea and Blattoidea + Corydioidea but without Anaplectidae - 1, yet will still note their support for these clades with this one exception. Single terminals are shown for other taxa even though some may prove paraphyletic or polyphyletic with further study (e.g., Pseudophyllodromiinae and Epilamprinae). We did not find any reliably supported relationships within most of the Blaberidae, and thus its phylogeny is largely a polytomy. In some cases, a clade was recovered but the study had insufficient taxon sampling to support that clade (e.g., Maekawa et al., 2003 recovered Blattodea as monophyletic by necessity because it did not include Mantodea or other outgroup taxa).
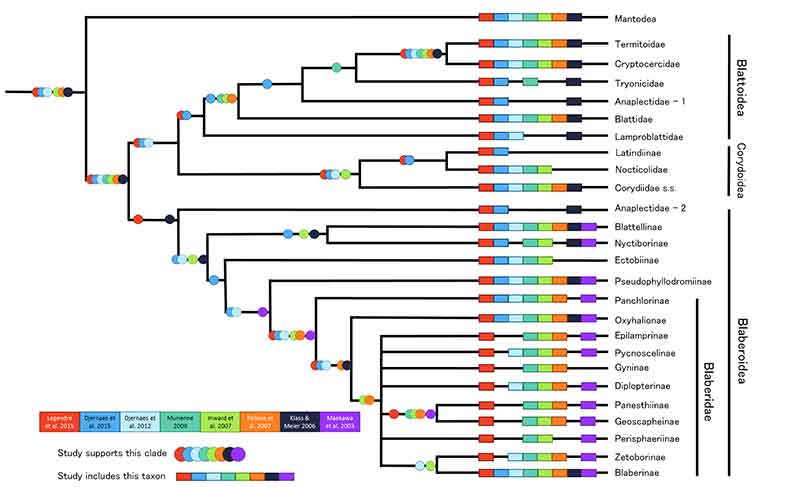
FIGURE 2. Simplified topology of Blattodea with fossil calibrations. Tree topology is simplified from Figure 1. Fossils are shown in grey with dashed lines to represent uncertain position within containing clade. Red symbol indicates the nodes each fossil calibrates with roman numerals indicating the fossil that corresponds to each node calibration. The minimum dates for each of the calibration points are: i - 125.45 Ma; ii - 52 Ma; iii - 48.14 Ma; iv - 48.14 Ma. Corydiidae s.s. consists of Holocompsinae, Tiviinae, and Euthyrrhaphinae. Corydiidae s.l. consists of Corydiidae s.s., Latindiinae and Nocticolinae. Note that no Ectobiinae other than Ectobius have been used in molecular phylogenetic studies to date.
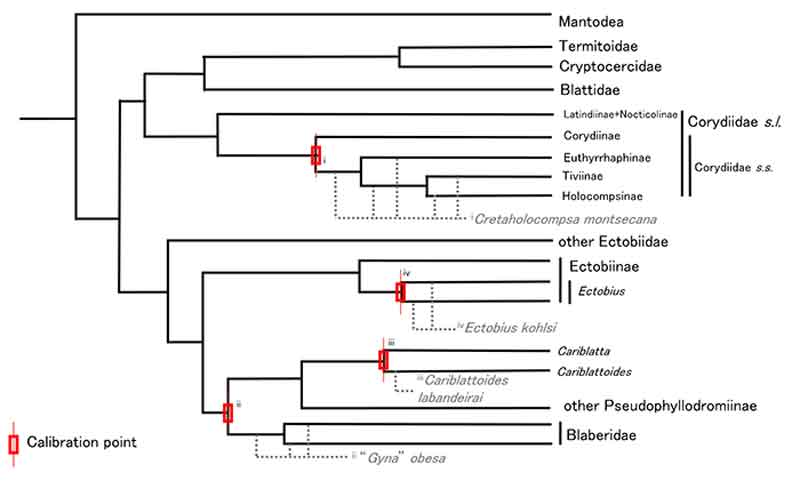
FIGURE 3. Illustrations of calibrating fossils. All illustrations reproduced with permission. Scale bars equal 1 mm. 1, Cretaholocompsa montsecana Martinez-Delclos, 1993 (in Martinez-Delclos, 1993, figure 8). 2, Cariblattoides labandeirai Vršanský, Vidlička, Čiampor, Jr. and Marsh 2012 (in Vršanský et al., 2012, figure 12). 3, Ectobius kohlsi Vršanský, Vidlička, and Labandeira 2014 (in Vršanský et al., 2014, figure 3).
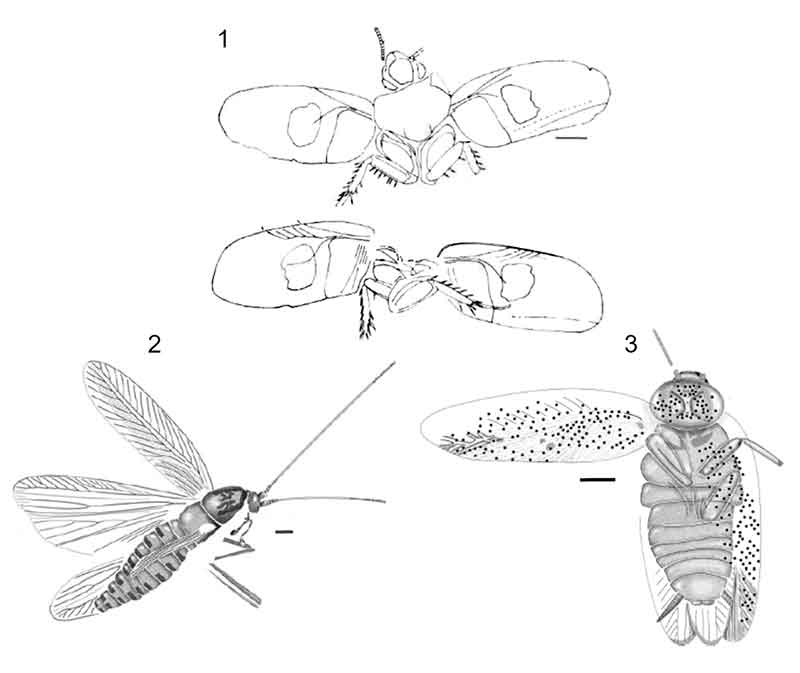
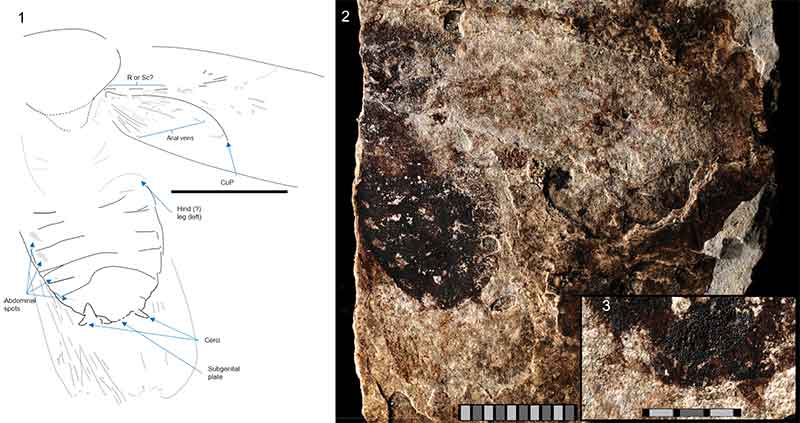
FIGURE 4. “Gyna” obesa (Piton, 1940) with ventral perspective. 1, Illustration of holotype. Hashed line on pronotum denotes two possible paths delimiting the posterior margin of the pronotum. Broken lines elsewhere denote damage or incomplete preservation. Scale bar equals 10 mm. 2, Photo of holotype MNHN.F.R06689. Photo is a composite of two images taken with polarized lighting at different angles. Scale 10 mm total. 3, Higher magnification of posterior end showing stout, segmented cerci and details of abdominal termination. Scale 3 mm total.