FIGURE 1. Phylogenetic tree showing the position of Vegavis iaai, illustrating the divergence calibrated by MLP 93-I-3-1.
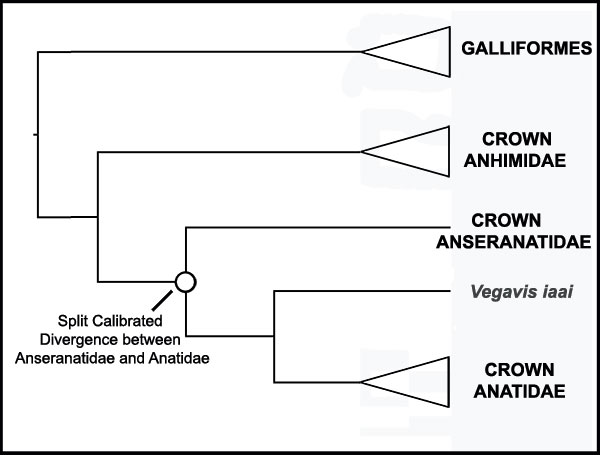
FIGURE 2. Stratigraphic distribution of fossil anatoids in the Paleogene. The minimum possible age of the calibrating specimen of Vegavis iaai is presented, and midpoints of age ranges are shown for the ages of other Paleogene anatoid specimens.
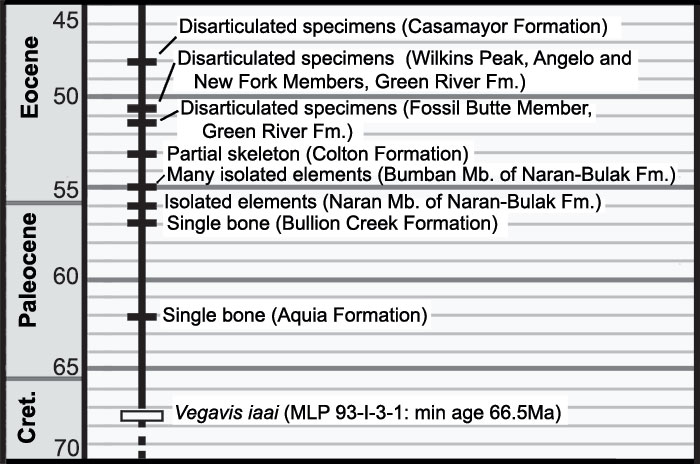
FIGURE 3. Phylogenetic tree showing position of Waimanu manneringi, illustrating the divergence calibrated by CM zfa35.
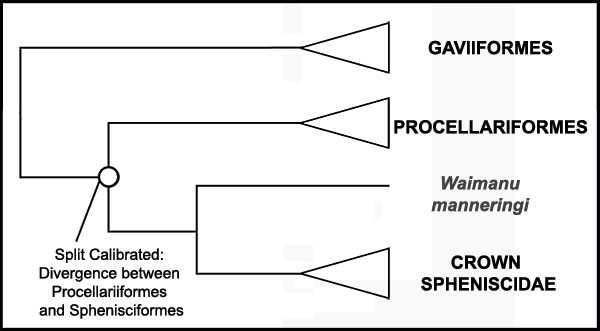
FIGURE 4. Stratigraphic distribution of fossil Sphenisciformes in the Paleogene. The minimum possible age of the calibrating specimen of Waimanu manneringi is presented, and midpoints of age ranges are shown for the ages of other Paleogene penguin specimens.
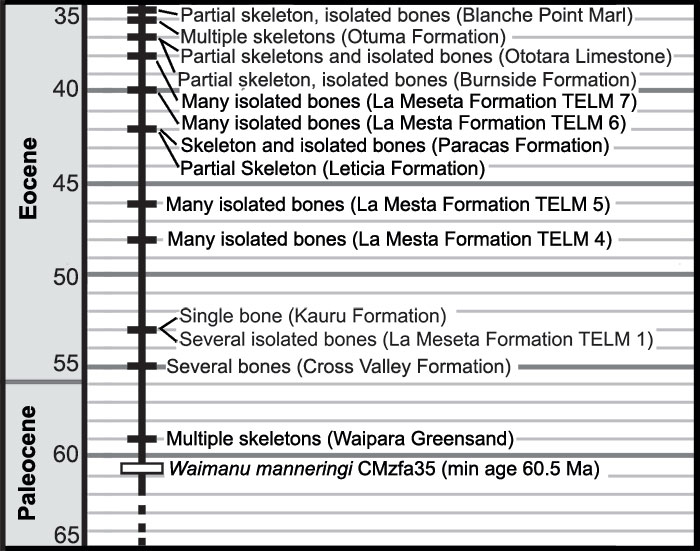
FIGURE 5. Phylogenetic tree showing position of Primobucco mcgrewi, illustrating the divergence calibrated by USNM 336484.
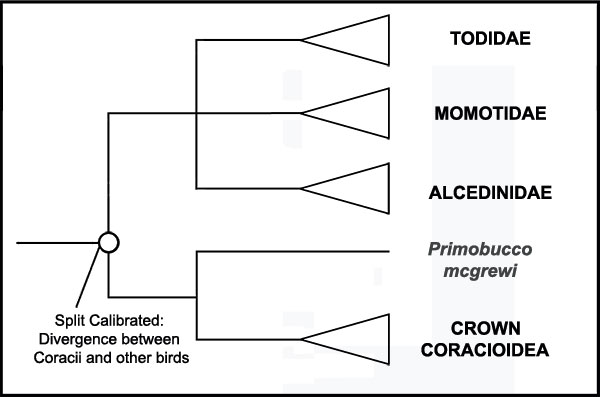
FIGURE 6. Stratigraphic distribution of fossil Coracii in the Paleogene. The minimum possible age of the calibrating specimen of Primobucco mcgrewi is presented, and midpoints of age ranges are shown for the ages of other Paleogene roller in specimens. A precise stratigraphic placement for the Condé-en-Brie specimen is not available (see text).
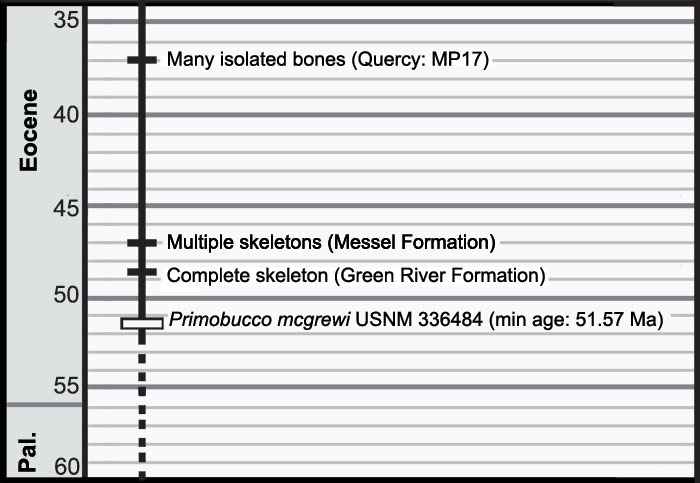
FIGURE 7. Phylogenetic tree showing position of Scaniacypselus wardi, illustrating the divergence calibrated by NHMUKA5430.
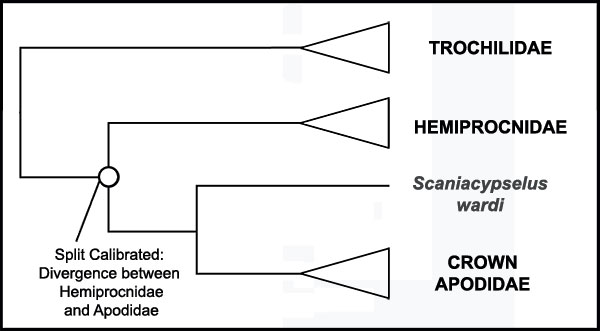
FIGURE 8. Stratigraphic distribution of fossil Pan-Apodidae in the Paleogene. The minimum possible age of the calibrating specimen NHMUK A5430 is presented, and midpoints of age ranges are shown for the ages of other Paleogene swift specimens.
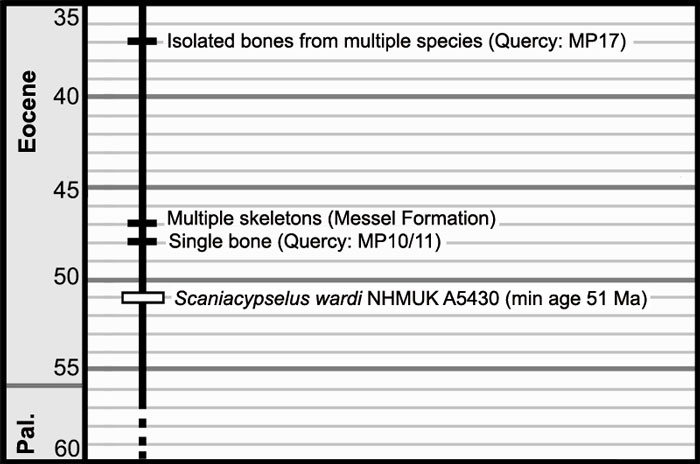
FIGURE 9. Phylogenetic tree showing position of Sandcoleus copiosus, illustrating the divergence calibrated by USNM 433912.
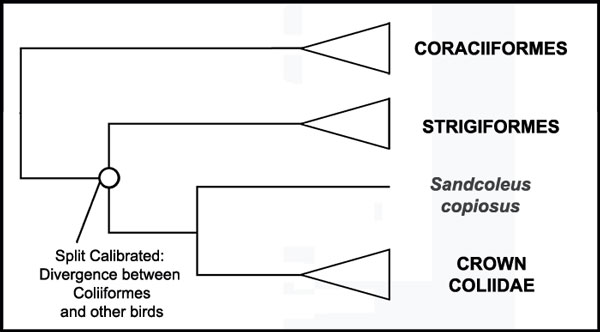
FIGURE 10. Stratigraphic distribution of fossil Coliiformes in the Paleogene. The minimum possible age of the calibrating specimen of Sandcoleus copiosus is presented, and midpoints of age ranges are shown for the ages of other Paleogene mousebird specimens.
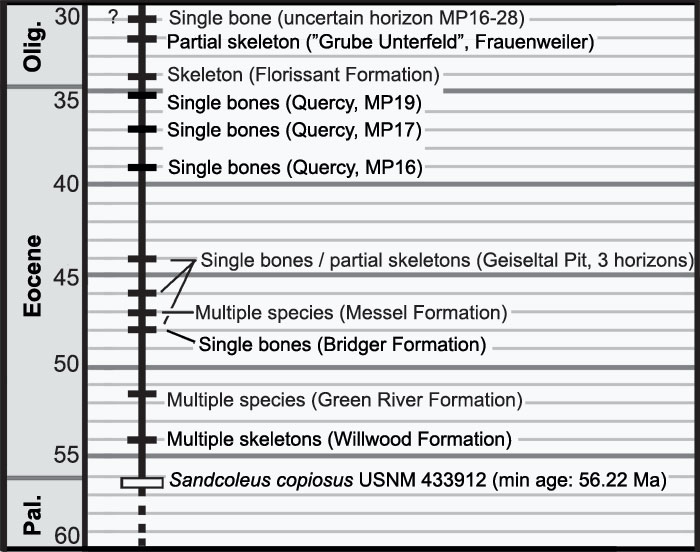
FIGURE 11. Phylogenetic tree showing position of Pulchrapollia gracilis, illustrating the divergence calibrated by NMH A6207. Placement of Pulchrapollia gracilis as a stem parrot is supported by multiple analyses (see text).
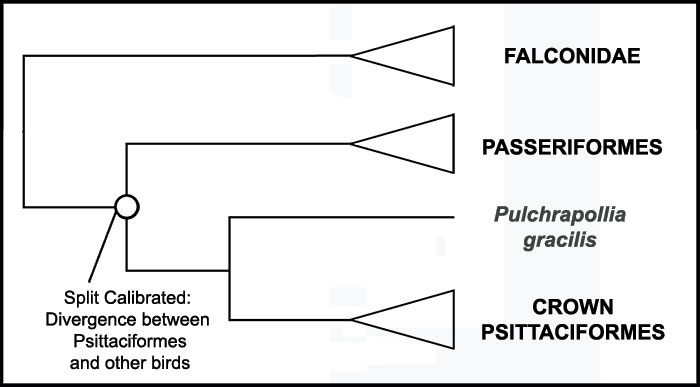
FIGURE 12. Stratigraphic distribution of fossil Pan-Psittaciformes in the Paleogene. The minimum possible age of the calibrating specimen NMH A6207 is presented, and midpoints of age ranges are shown for the ages of other Paleogene parrot specimens. Note that the London Clay Formation also contains multiple associated skeletons and isolated bones in addition to the holotype of Pulchrapollia gracilis that serves as a calibration point.
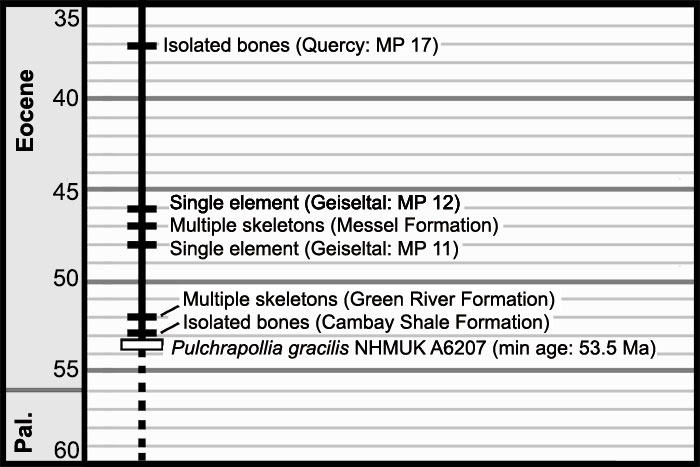
FIGURE 13. Phylogenetic tree showing position of Messelirrisor halcyrostris, illustrating the divergence calibrated by SMF-ME 1883a+b.
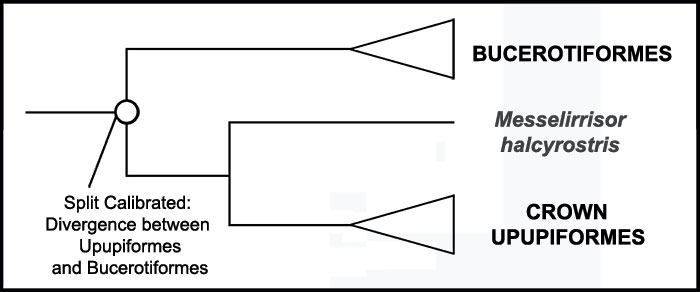
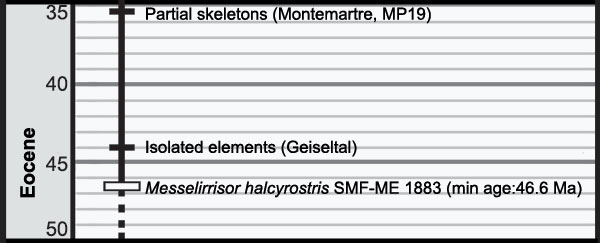
FIGURE 14. Stratigraphic distribution of fossil Upupiformes in the Paleogene. The minimum possible age of the calibrating specimen SMF-ME 1883a+b is presented, and midpoints of age ranges are shown for the ages of other Paleogene Upupiformes. The fossil record of Upupiformes is probably more complete than implied by the figure as several important specimens may belong to this clade await evaluation (see text).