FIGURE 1. Geographical map showing the fossil bearing localities. Circles size is proportional to the number of individuals. Colour scale is proportional to relative age (ka).
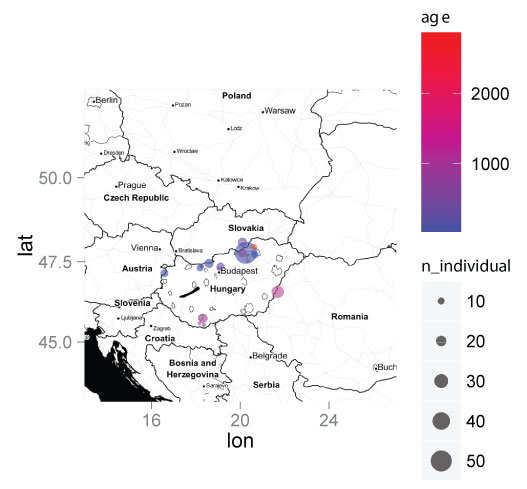
FIGURE 2. 1, Landmarks (large grey circles) and semilandmarks (small white circles) digitized on the humerus in caudal norm: 1) lateral end of greater tuberosity; 2) articular facet for clavicula; 3) proximal edge of the articular facet for clavicula; 4) bicipital notch; 5) proximal end of lesser tuberosity; 6) medial edge of the minor tuberosity; 7) lateral edge of the lesser tuberosity; 8) bicipital ridge; 9) middle point of the bicipital tunnel; 10) lateral end of the scalopine ridge; 11) proximal end of the teres tubercle; 12-14) surface of the teres tubercle; 15) distal end of the teres tubercle; 16-18) minor sulcus; 19) posterior margin of the lateral epicondyle; 21-22) lateral epicondyle; 22-24) trochlear area; 25-27) medial epicondyle; 28) posterior margin of the medial epicondyle; 29-32) greater sulcus; 33-36) humeral head. Scalebar equals 1 mm. 2, Insertion areas of the main muscles involved in the digging movement. 1 . Pectoral ridge where muscle Pectoralis pars sternalis inserts. 2 . Teres tubercle where muscles Teres major and Latissimus dorsi inserts.
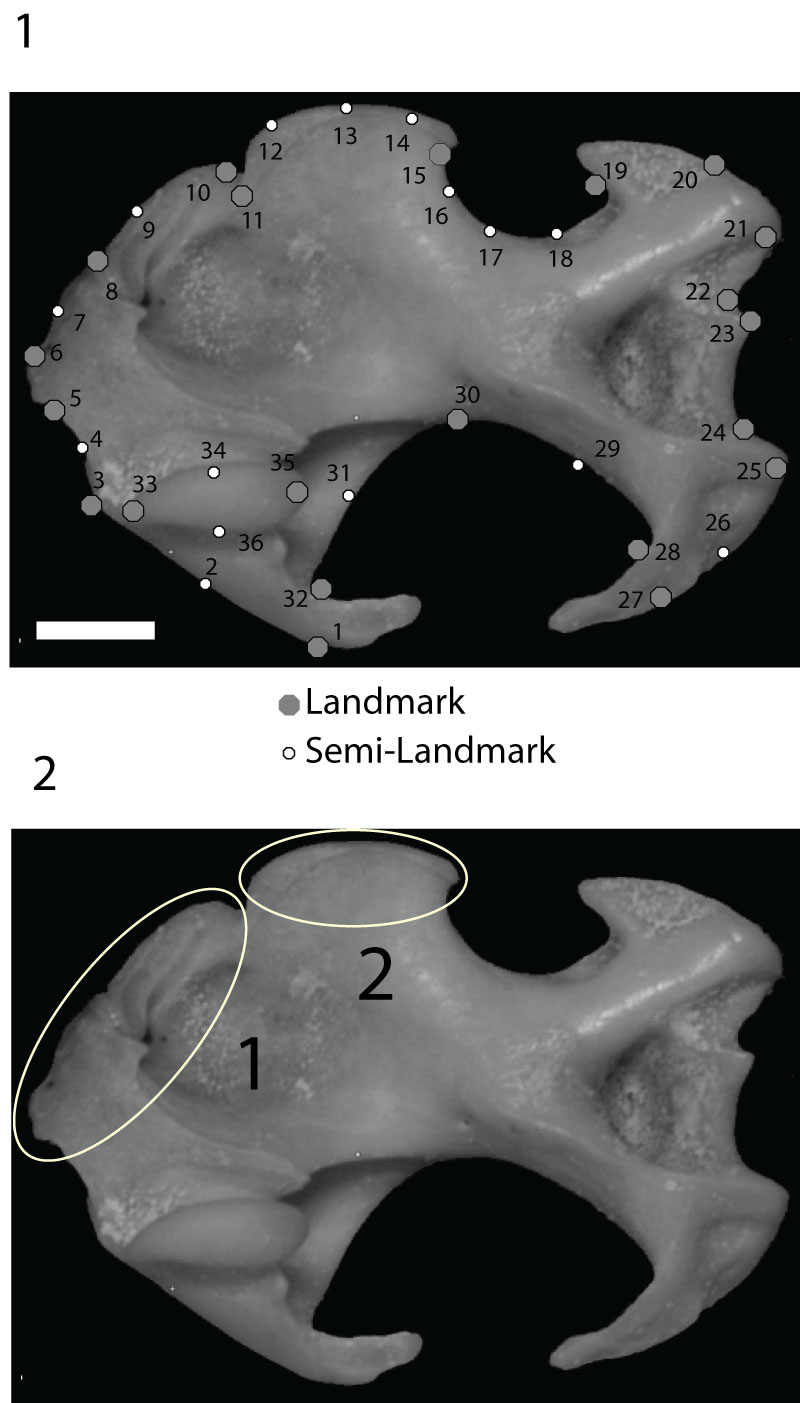
FIGURE 3. 1, Scatterplot of the first two axes of the PCA. Deformation grids refer to axes extremes (positive and negative values). 2, Scatterplot of the first and third axes of PCA. Deformation grids refer to axes extremes (positive and negative values).
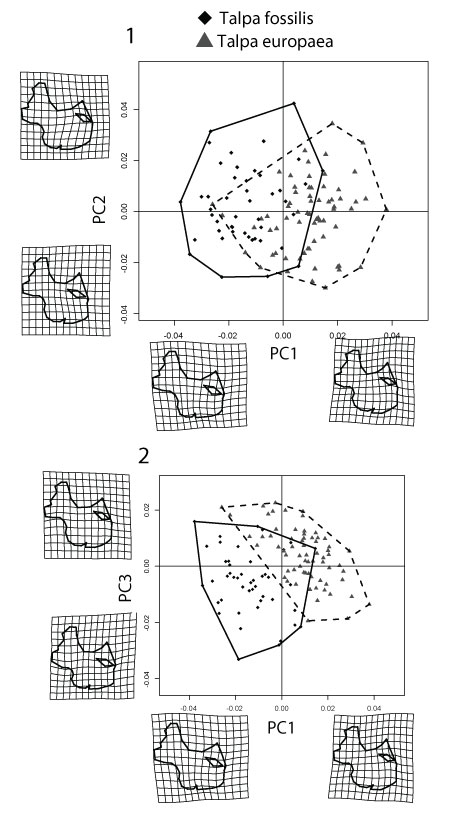
FIGURE 4. Boxplot of the centroid sizes. Bottom and top of the boxes are the first and third quartiles; horizontal solid black lines represent the median; whiskers represent the minimum and maximum values.
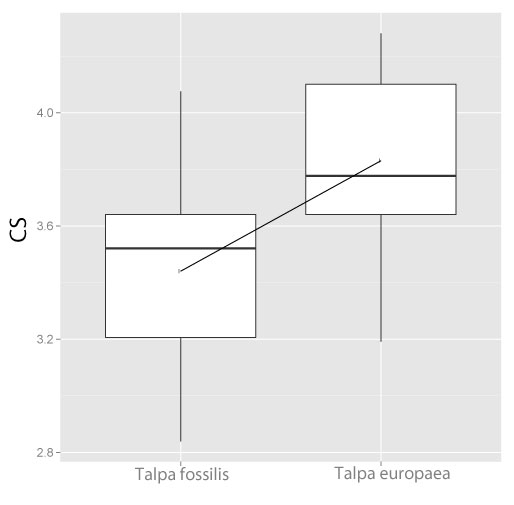
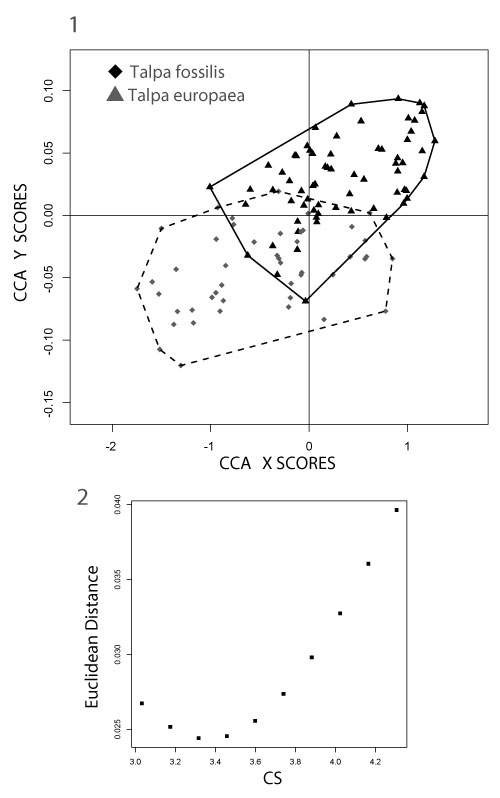
FIGURE 5. 1, CCA scatterplot of the shape and size variables. 2, Plot of the Euclidean distances between the predicted shape values of Talpa fossilis and T. europaea against 10 discrete CS intervals.