FIGURE 1. Size categories of specimens of Protoceratops andrewsi used in this study. Right to left: young juvenile, juvenile, subadult, adult. Scale bar is 1 m. Image modified from Hone et al. (2014a), original illustration by David Maas.
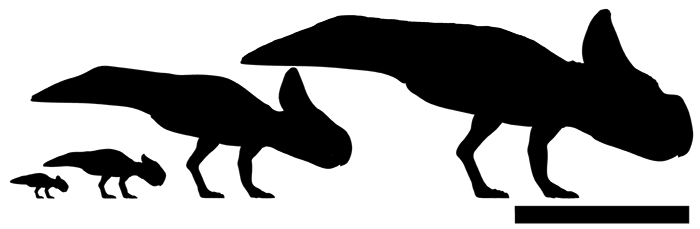
FIGURE 2. Changes in skull shape in Protoceratops andrewsi. All skulls are drawn to the same total length and are seen in dorsal view (upper row) and right lateral view (lower row). Left to right (with sources in parentheses) small juveniles (Fastovsky et al., 2011), juveniles (MPC-D 100/526), subadults (MPC-D 100534), putative ‘female’ morph, putative ‘male’ morph (both Dodson, 1976). The large fenestrae seen in the smallest animals are supratemporal fenestra and are not homologous with the frills of the fenestra in the larger animals.
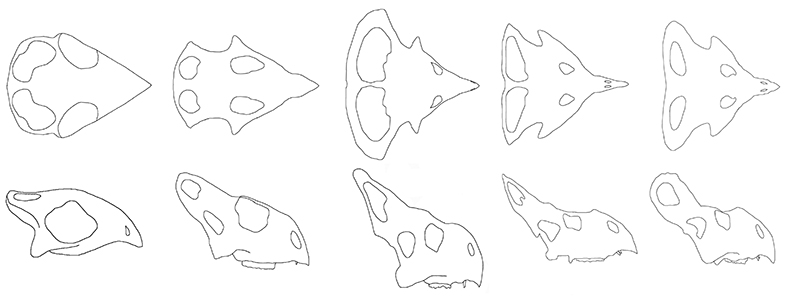
FIGURE 3. Measurements taken from skulls of Protoceratops based on an idealised adult in dorsal view (above) and lateral view (below). Black lines and numbers indicate the measurements taken according to the variable of Dodson (1976). These are: 1, basal skull length; 2, total length (frill length is variable 2 subtracted from variable 1); 8, jugal width; 9, frill width; 13, orbit length; 14, orbit height. The grey lines indicate the maximum and minimum lengths of the frill as measured in juvenile animals. See text for further details.
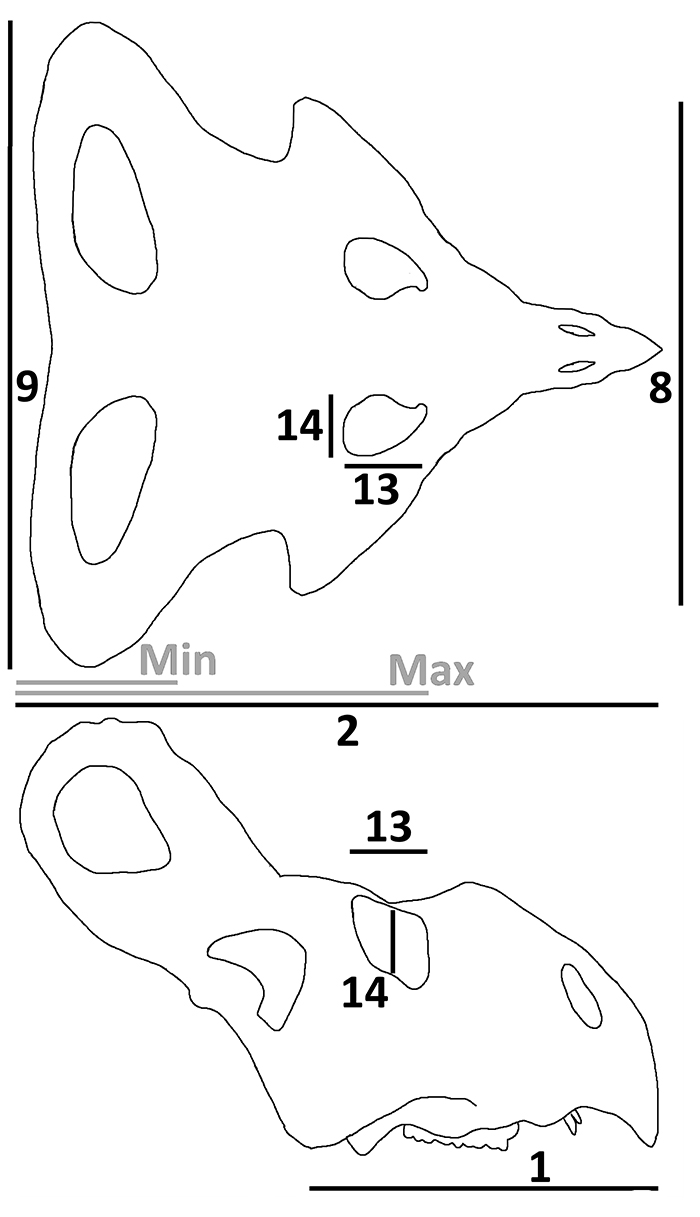
FIGURE 4. Allometric relationships for frill length ( 1), frill width ( 2) and the width across the jugal bosses ( 3). Solid lines show the fitted lines from SMA regression, dashed grey lines show the line of isometry (slope = 1 and intercept = 0). All measurements were originally in mm prior to log transformation.
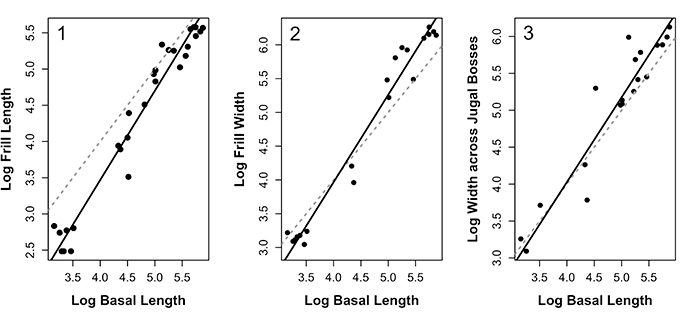
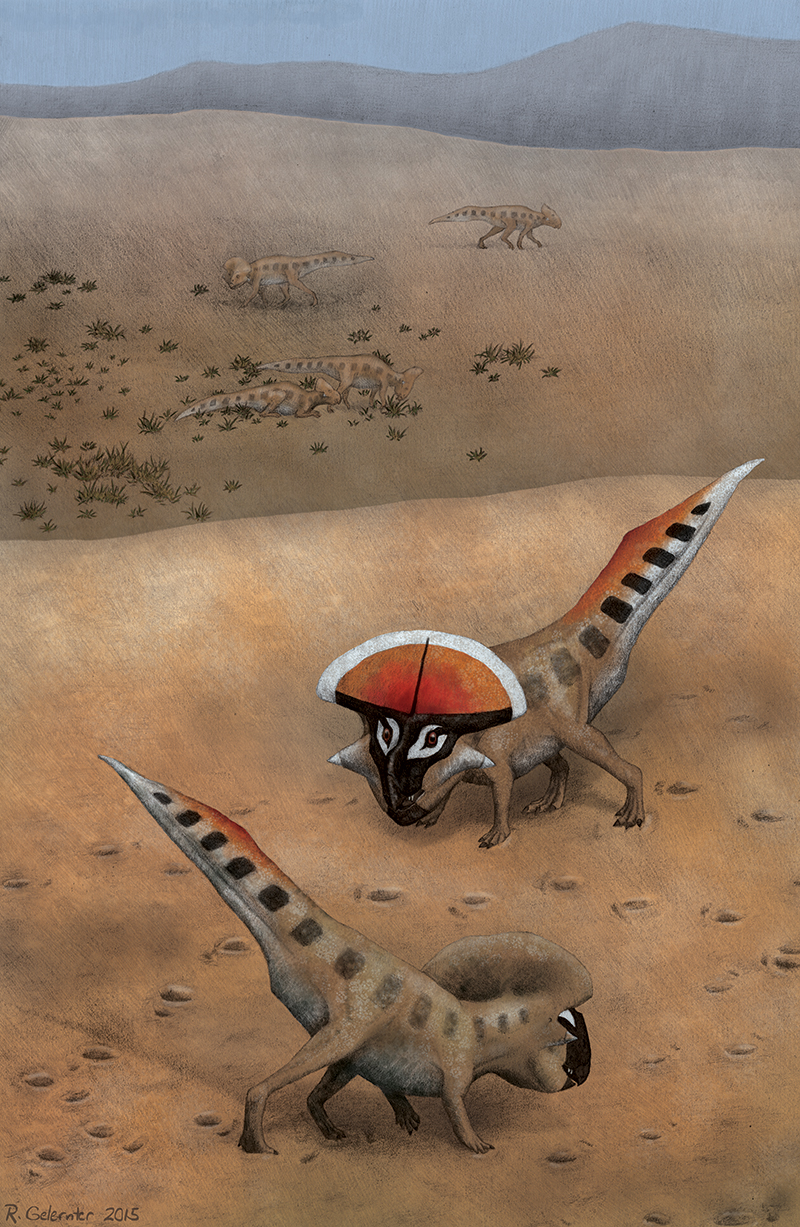
FIGURE 5. Life restoration of adult Protoceratops andrewsi (foreground) engaging in speculative display postures, an activity in which non-mature animals (background) do not take part. Artwork by Rebecca Gelernter, who retains the copyright on this image–used with permission.