FIGURE 1. 1, Location map of the Butterloch-Bletterbach area - Redagno; 2, Schematic drawing of the Butterloch-Bletterbach section with the distribution of ichnotaxa; red tracks indicates the stratigraphic level from which the studied footprints came (from Ceoloni et al., 1988, redrawn and slightly modified).
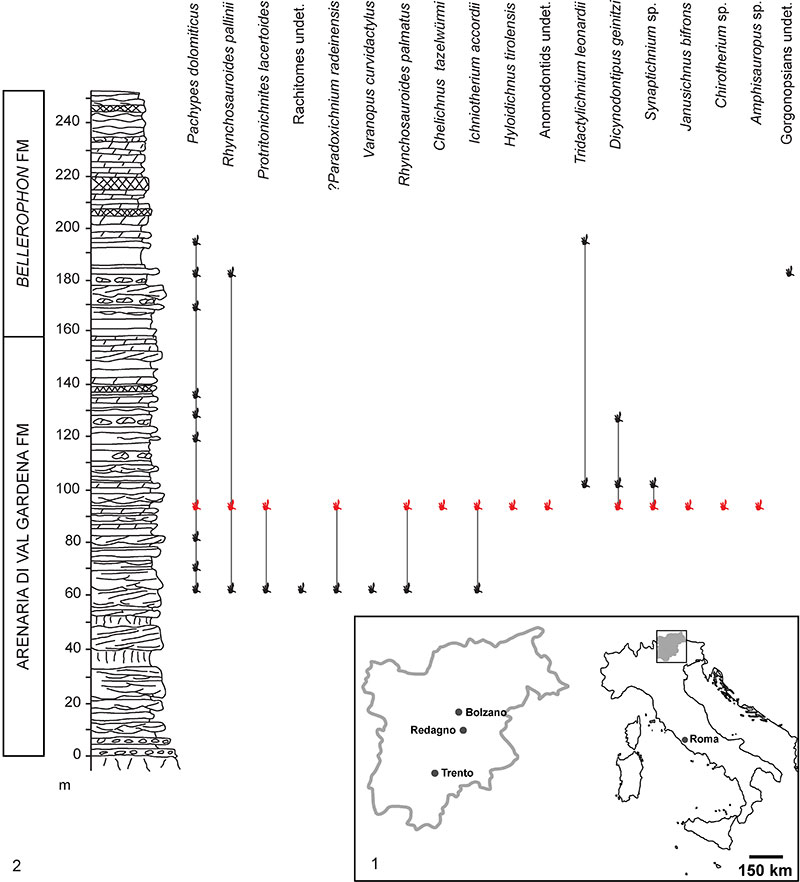
FIGURE 2. Orthophoto of the slab MPUR NS 34/28. Scale bar is 50 cm.
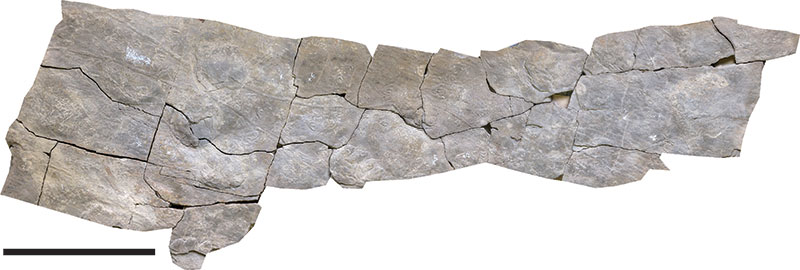
FIGURE 3. 1-2, Chelichnus tazelwürmi ; 3, Janusichnus bifrons ; 4, Ganasauripus ladinus. Scale bar is 1 cm. Roman numerals refer to digits.
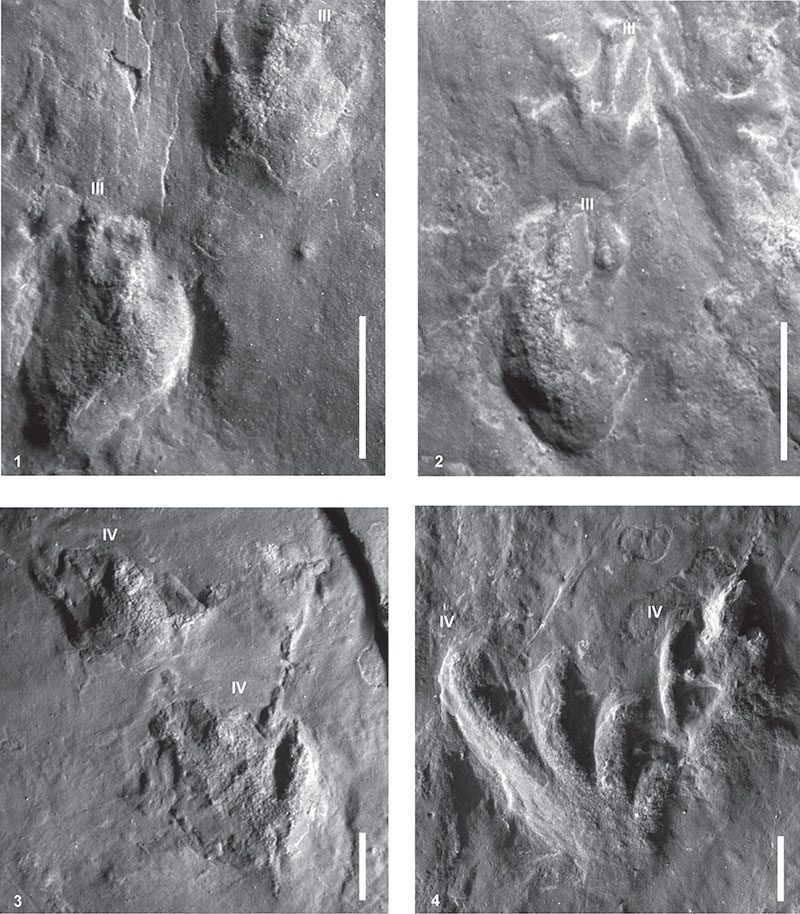
FIGURE 4. 1, Ganasauripus ladinus ; 2, Pachypes dolomiticus manus; 3-4, Pachypes dolomiticus pedes. Scale bar is 1 cm ( 1 ) and 5 cm ( 2-4 ). Roman numerals refer to digits.
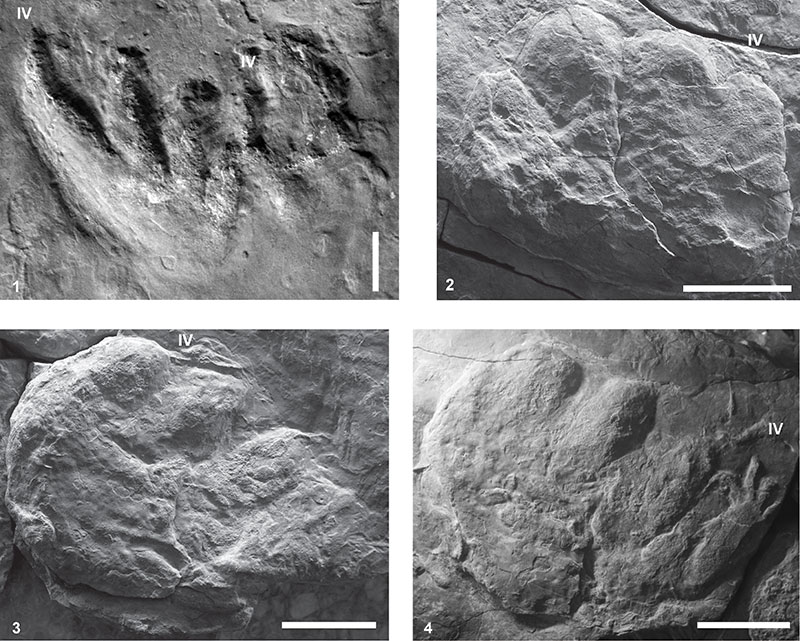
FIGURE 5. Event timeline. 1, Ripple marks and Gl1 tracks formation; 2, Gl2 and Gl3 tracks formation; 3; Gl4 trackway formation; 4, Jb trackway formation; 5, Gl5 and Ct1 trackways formation; 6, Ct2 trackway formation; 7, Gl6 and Gl7 trackways formation; 8, Pd trackway formation; 9, Final interpretative drawing of the slab MPUR NS 34/28; 10, Trackmakers advancement directions. rip, ripple marks; Pd, Pachypes dolomiticus trackway; Ct1-Ct2, Chelichnus tazelwürmi trackways; Gl1-Gl7, Ganasauripus ladinus trackways; Jb, Janusichnus bifrons trackway; dcr, ? desiccation cracks. Scale bar is 50 cm.
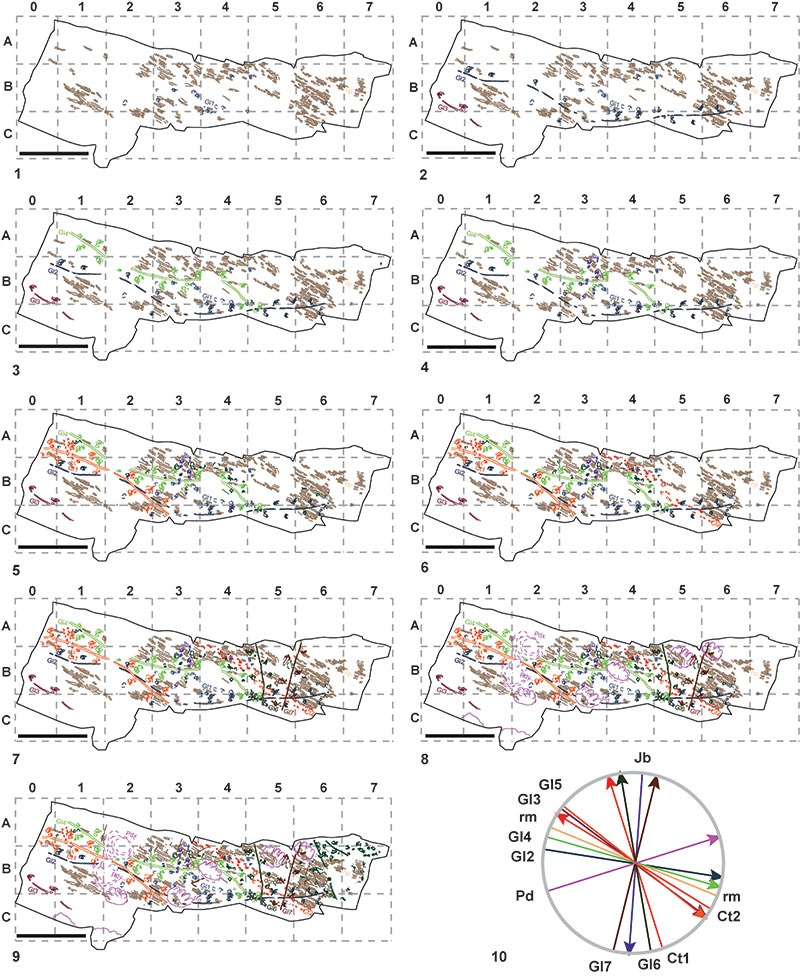
FIGURE 6. Slab MPUR NS 34/28. 1, Ripple marks counterprints; 2, Interference between ripple marks counterprints and Gl7 trackway. Scale bar is 5 cm.
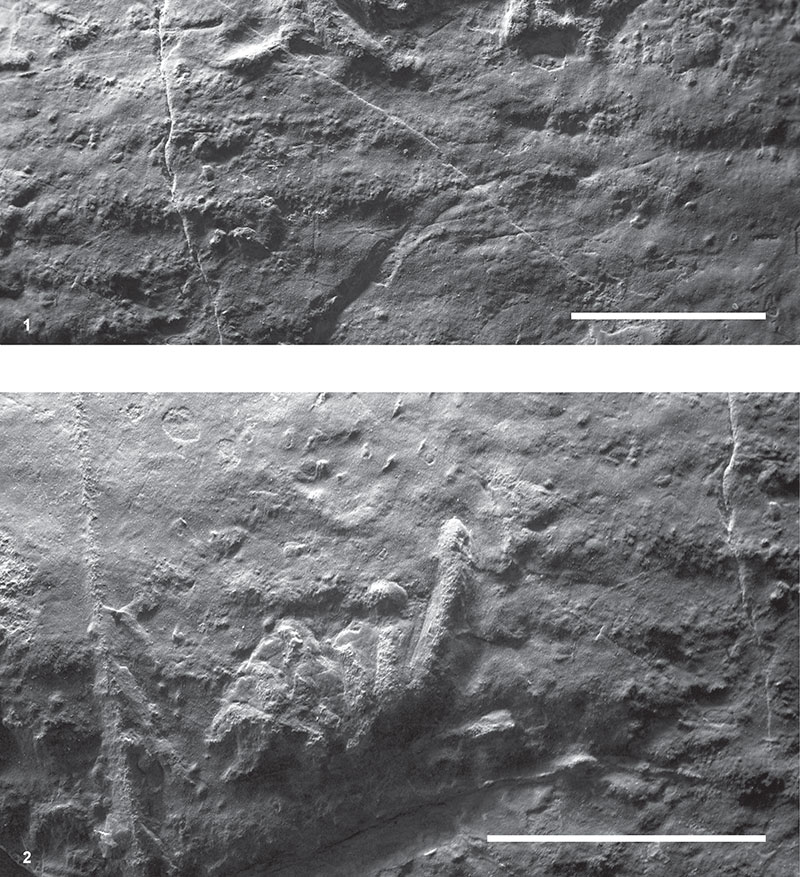
FIGURE 7. Slab MPUR NS 34/28. 1, Swimming traces (indicated by black and white arrows) belonging to trackway Gl1; 2-3, Close-up of the best Gl1 tracks. Scale bar is 5 cm ( 1) and 1 cm ( 2-3).
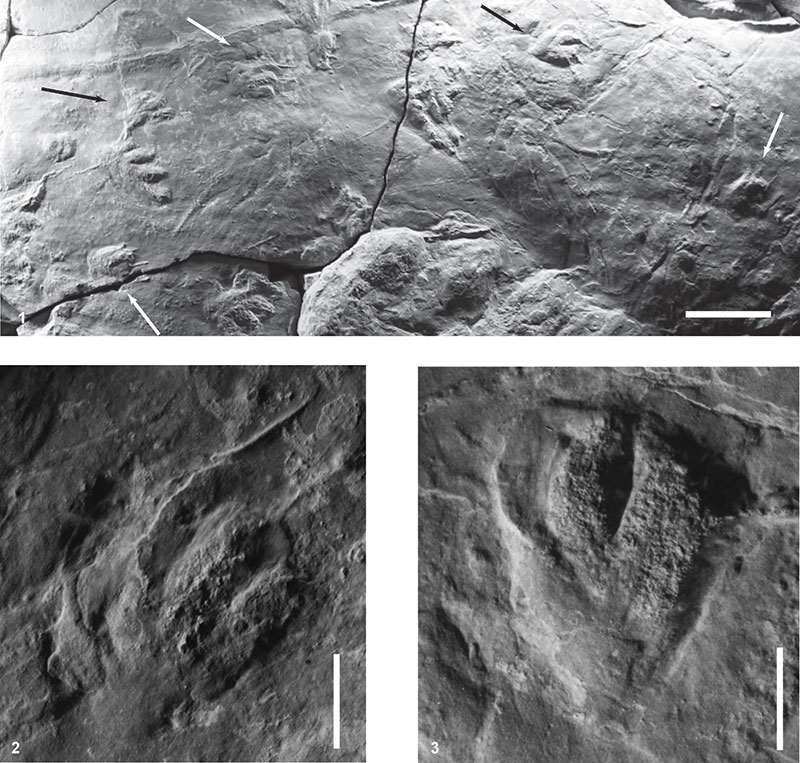
FIGURE 8. Slab MPUR NS 34/28. 1, Interference between trackways Gl4 and Pd indicating the relative antecedence of Gl4 trackmaker; 2, Trackway Pd, sets 2 and 3 interfering with Gl2, Gl4, Gl5 and Jb trackways. Scale bar is 5 cm.
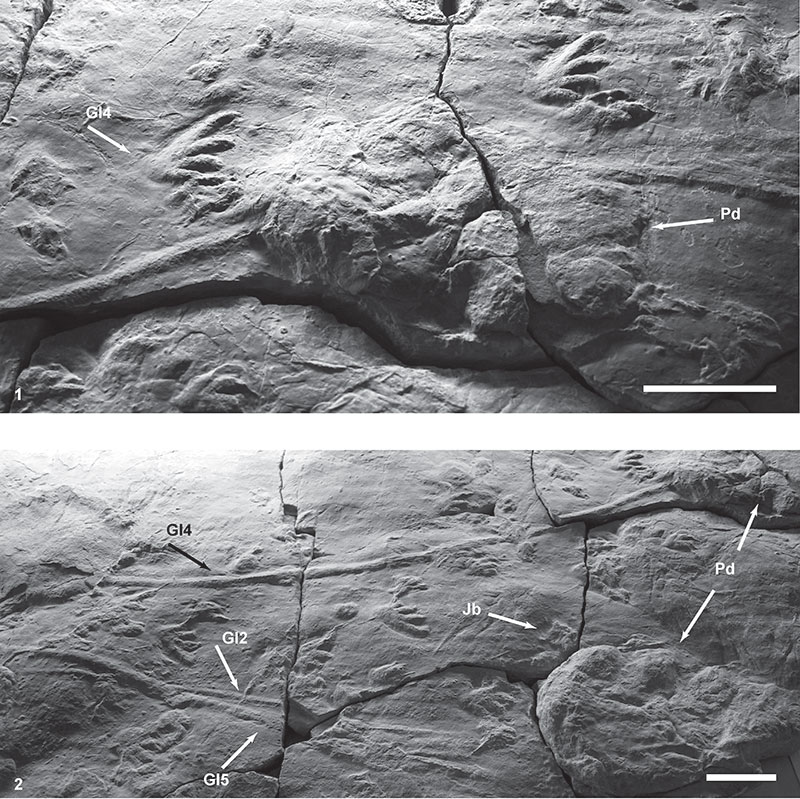
FIGURE 9. 1, Drawing of different parts making up the slab; 2, 3D photogrammetric false coloured model; 3, 3D photogrammetric shaded grey model. Scale bar is 0,5 m.
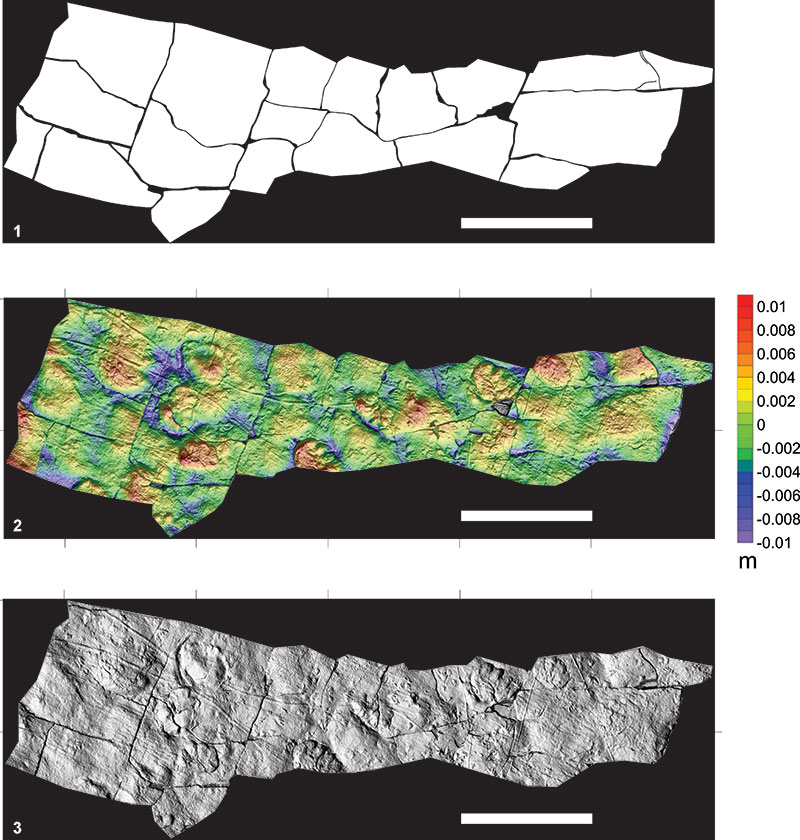
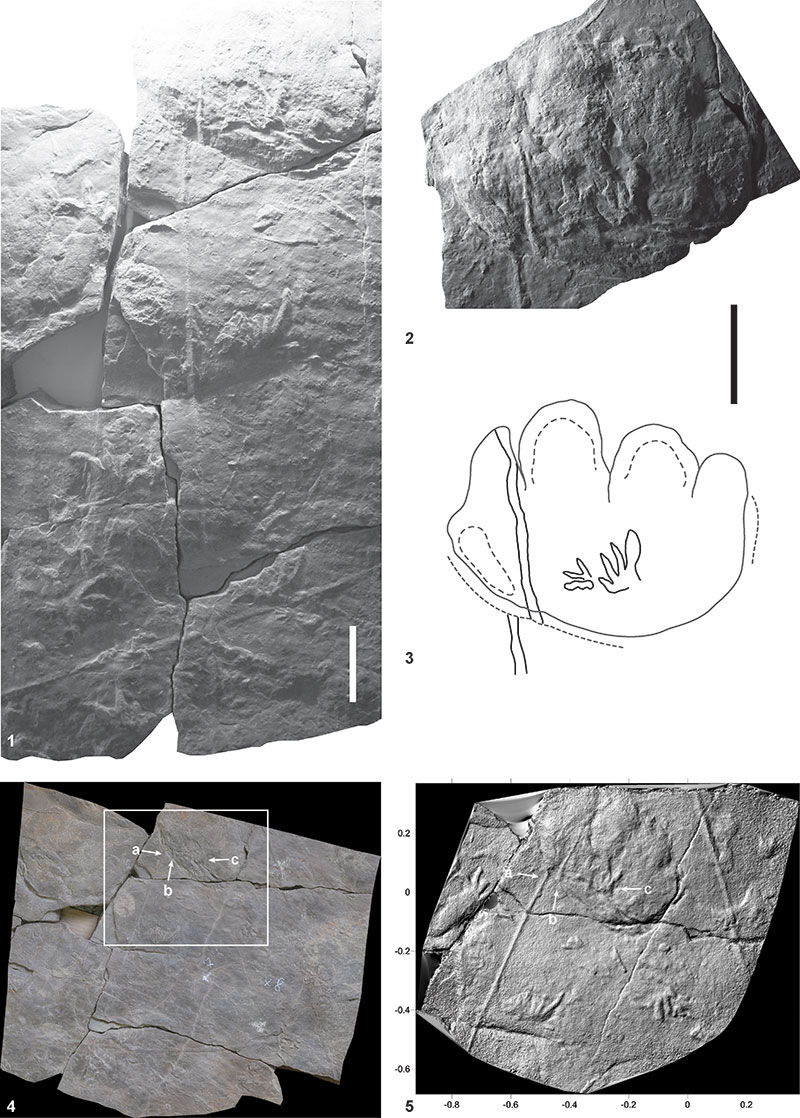
FIGURE 10. 1, Trackway Gl6; 2, Close up of the Gl6-Pd interference; 3, Interpretative drawing of Gl6-Pd interference; 4, Orthophoto of trackway Gl6; 5, Shaded grey photogrammetric model of the interference. White arrows and letters a, b and c indicate interruption (a), displacement (b) of the tail trace, and trackway Gl6 last set (c). Scale bar is 5 cm.