

FIGURE S1. Map of Von Mises stress distribution in the 12 meshes of Chlamyphorus truncates obtained when evaluating the influence of size of the elements in the mesh.
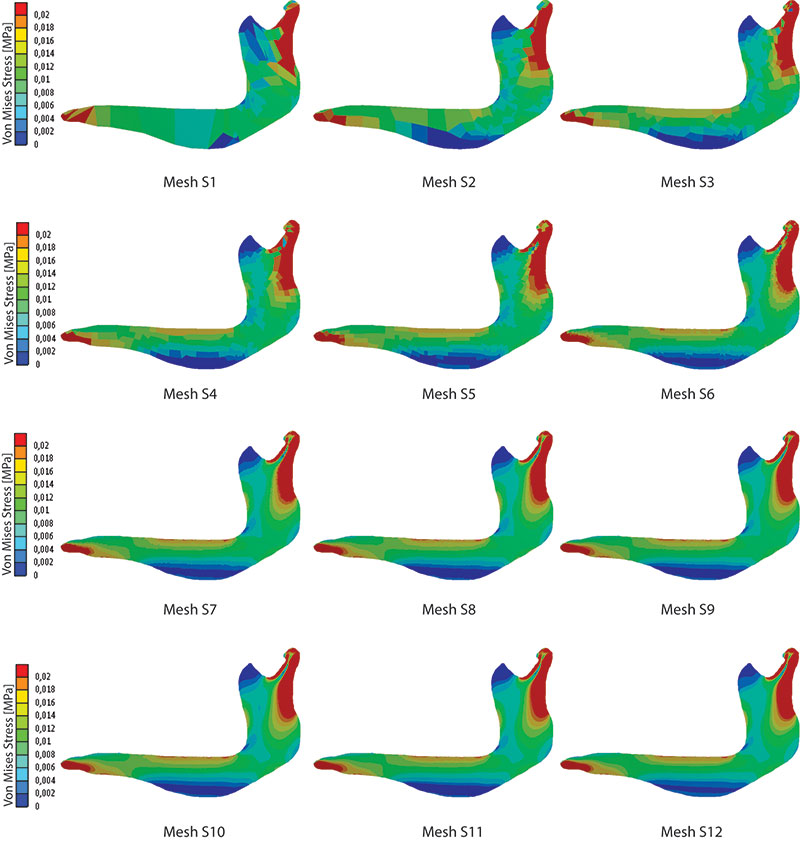
FIGURE S2. Map of Von Mises stress distribution in the six meshes of Chlamyphorus truncates obtained when evaluating the influence of the homogeneity of the mesh.
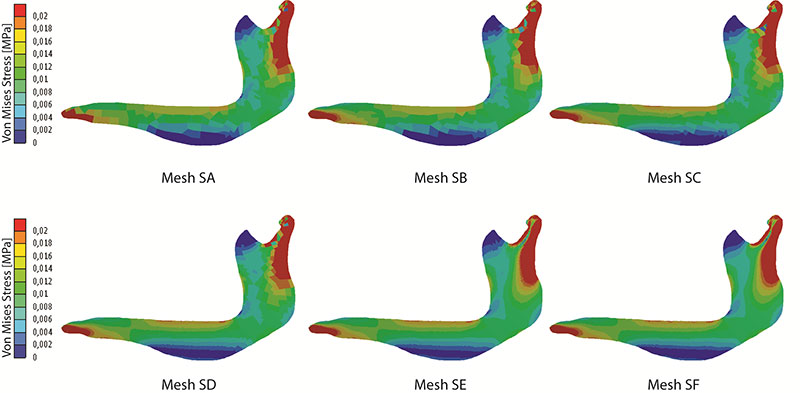
FIGURE S3. Map of Von Mises stress distribution in the 20 FEA models of Cingulata mandibles.
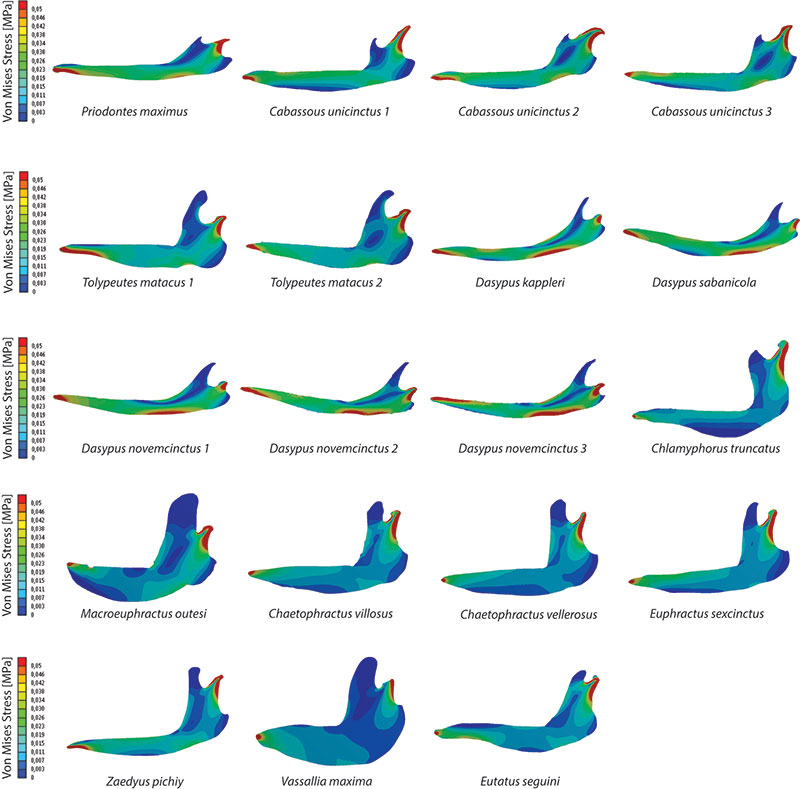
TABLE S1. Nodes of the model and values obtained for the 12 different meshes of Chlamyphorus truncates when varying the overall element size of: Arithmetic Mean (AM), Mesh-Weighted Arithmetic Mean (MWAM), Median (M), Mesh-Weighted Median (MWM), Percentage Error of the Arithmetic Mean (PEofAM) and Percentage Error of the Median (PEofM).
| Overall Element Size [mm] |
Nodes | AM [MPa] |
MWAM [MPa] |
M [MPa] |
MWM [MPa] |
PEofAM [%] |
PEofM (%) |
|
| 1 | 5 | 255 | 1.310E-02 | 1.227E-02 | 8.33E-03 | 8.74E-03 | 6.75 | 4.96 |
| 2 | 2 | 328 | 1.218E-02 | 1.234E-02 | 8.18E-03 | 7.46E-03 | 1.29 | 8.79 |
| 3 | 1 | 477 | 1.281E-02 | 1.285E-02 | 8.98E-03 | 8.39E-03 | 0.29 | 6.56 |
| 4 | 0.75 | 612 | 1.265E-02 | 1.292E-02 | 8.96E-03 | 7.84E-03 | 2.06 | 12.45 |
| 5 | 0.5 | 946 | 1.204E-02 | 1.300E-02 | 9.08E-03 | 7.96E-03 | 7.33 | 12.34 |
| 6 | 0.25 | 2619 | 1.253E-02 | 1.304E-02 | 9.29E-03 | 8.79E-03 | 3.96 | 5.43 |
| 7 | 0.1 | 13013 | 1.286E-02 | 1.308E-02 | 9.55E-03 | 9.32E-03 | 1.72 | 2.48 |
| 8 | 0.075 | 22525 | 1.301E-02 | 1.310E-02 | 9.59E-03 | 9.43E-03 | 0.71 | 1.72 |
| 9 | 0.05 | 48557 | 1.300E-02 | 1.313E-02 | 9.61E-03 | 9.31E-03 | 0.96 | 3.09 |
| 10 | 0.025 | 191368 | 1.308E-02 | 1.318E-02 | 9.63E-03 | 9.29E-03 | 0.71 | 3.53 |
| 11 | 0.02 | 298366 | 1.308E-02 | 1.319E-02 | 9.65E-03 | 9.22E-03 | 0.88 | 4.44 |
| 12 | 0.015 | 528034 | 1.311E-02 | 1.321E-02 | 9.65E-03 | 9.27E-03 | 0.73 | 3.93 |
TABLE S2. Per cent relative error (ε[%]) obtained for the convergence of 12 different meshes of Chlamyphorus truncates when varying the overall element size of Arithmetic Mean (AM), Mesh-Weighted Arithmetic Mean (MWAM), Median (M) and Mesh-Weighted Median (MWM).
| AM [%] |
MWAM [%] |
M [%] |
MWM [%] |
|
| 1 | - | - | - | - |
| 2 | 6.96 | 0.62 | 1.80 | 14.67 |
| 3 | 5.15 | 4.09 | 9.75 | 12.42 |
| 4 | 1.23 | 0.55 | 0.23 | 6.51 |
| 5 | 4.82 | 0.60 | 1.40 | 1.53 |
| 6 | 4.00 | 0.34 | 2.31 | 10.37 |
| 7 | 2.63 | 0.30 | 2.83 | 6.04 |
| 8 | 1.19 | 0.16 | 0.42 | 1.20 |
| 9 | 0.03 | 0.22 | 0.12 | 1.27 |
| 10 | 0.62 | 0.36 | 0.28 | 0.18 |
| 11 | 0.06 | 0.11 | 0.18 | 0.77 |
| 12 | 0.24 | 0.10 | 0.04 | 0.57 |
TABLE S3. Nodes of the model and values obtained for the six different meshes of Chlamyphorus truncates when varying the homogeneity of the mesh of: Arithmetic Mean (AM), Mesh-Weighted Arithmetic Mean (MWAM), Median (M), Mesh-Weighted Median (MWM), Percentage Error of the Arithmetic Mean (PEofAM) and Percentage Error of the Median (PEofM). Refined Area is the percent value of area with homogeneous mesh.
| Refined Area [%] |
Nodes | AM [MPa] |
MWAM [MPa] |
M [MPa] |
MWM [MPa] |
PEofAM [%] |
PEofM (%) |
|
| 1 | 0.00 | 477 | 1.28E-02 | 1.28E-02 | 8.98E-03 | 8.39E-03 | 0.29 | 6.56 |
| 2 | 7.20 | 2173 | 1.68E-02 | 1.29E-02 | 1.44E-02 | 1.66E-02 | 30.37 | 15.14 |
| 3 | 23.38 | 5644 | 1.27E-02 | 1.29E-02 | 1.19E-02 | 1.23E-02 | 1.27 | 3.82 |
| 4 | 47.16 | 11029 | 1.01E-02 | 1.29E-02 | 9.93E-03 | 9.93E-03 | 21.89 | 0.01 |
| 5 | 69.98 | 18145 | 1.32E-02 | 1.31E-02 | 9.60E-03 | 9.53E-03 | 0.54 | 0.65 |
| 6 | 100.00 | 22526 | 1.30E-02 | 1.31E-02 | 9.59E-03 | 9.43E-03 | 0.70 | 1.72 |
TABLE S4. Per cent relative error (ε[%]) obtained for the convergence of 12 different meshes of Chlamyphorus truncates when varying the homogeneity of the mesh of Arithmetic Mean (AM), Mesh-Weighted Arithmetic Mean (MWAM), Median (M) and Mesh-Weighted Median (MWM).
| AM [%] |
MWAM [%] |
M [%] |
MWM [%] |
|
| 1 | - | - | - | - |
| 2 | 26.94 | 0.01 | 51.37 | 110.28 |
| 3 | 19.88 | 0.28 | 12.15 | 32.97 |
| 4 | 19.59 | 0.34 | 13.70 | 13.85 |
| 5 | 27.08 | 1.24 | 5.91 | 5.65 |
| 6 | 2.17 | 0.09 | 0.71 | 1.23 |
