FIGURE 1. Twelve meshes of Chlamyphorus truncates obtained when evaluating the influence of size of the elements in the mesh.
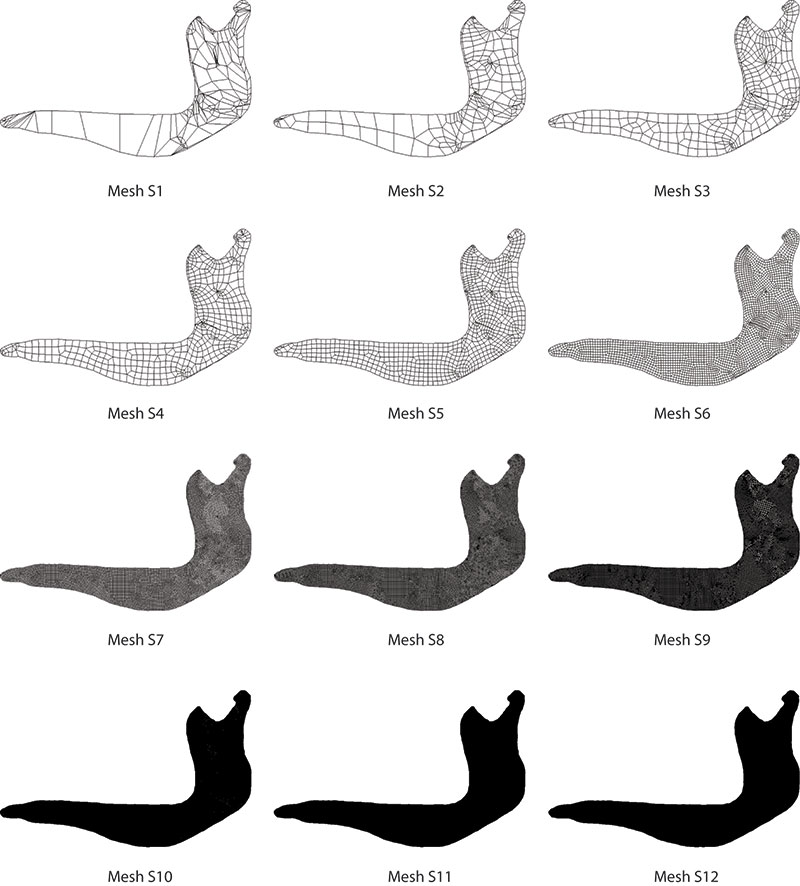
FIGURE 2. Six meshes of Chlamyphorus truncates obtained when evaluating the influence of the homogeneity of the mesh.
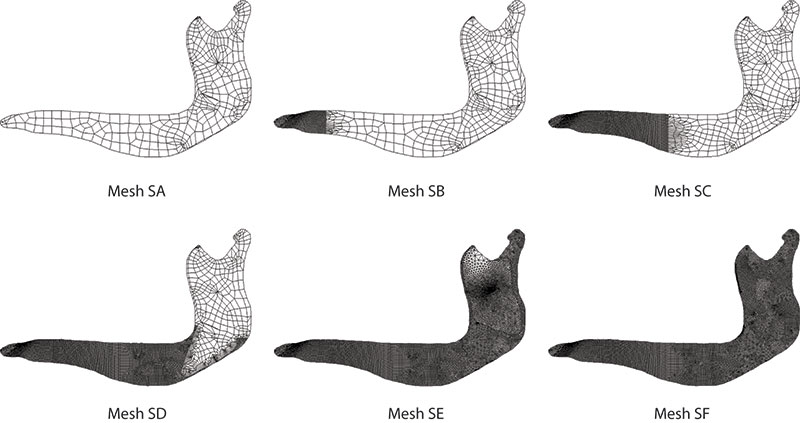
FIGURE 3. Evolution of the values of Arithmetic Mean (AM), Mesh-Weighted Arithmetic Mean (MWAM), Median (M), Mesh-Weighted Median (MWM), Percentage Error of the Arithmetic Mean (PEofAM) and Percentage Error of the Median (PEofM) in front of the size of the elements (1) and the uniformity of the mesh (2). Meshes from a Chlamyphorus truncates. S07 refers to Mesh S7 (mesh size), SE refers to Mesh SE (mesh homogeneity).
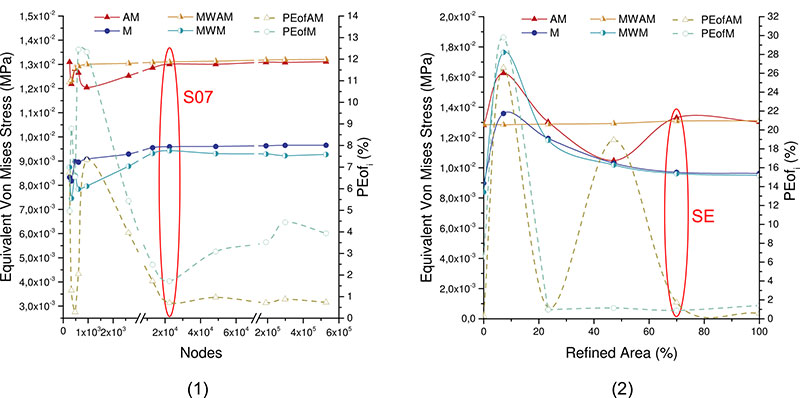
FIGURE 4. Evolution of the convergence error of each iteration of Arithmetic Mean (AM), Mesh-Weighted Arithmetic Mean (MWAM), Median (M), Mesh-Weighted Median (MWM) in front of the number of nodes (1) and the percentage of Refined Area (percent value of area with homogeneous mesh) (2). Meshes from a Chlamyphorus truncates. S07 refers to Mesh S7 (mesh size), SE refers to Mesh SE (mesh homogeneity).
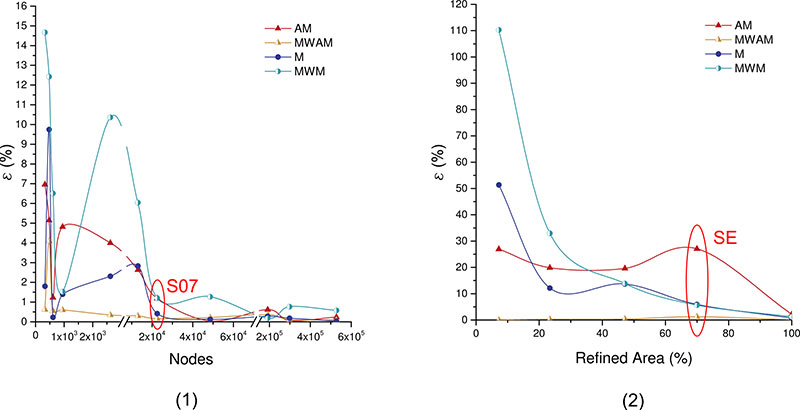
FIGURE 5. Evolution of the box-plots of the Von Mises stress distribution. X-axes refers to meshes S01 to S12: the size of the elements (1); and meshes SA to SF: the uniformity of the mesh (2). Meshes from a Chlamyphorus truncates.
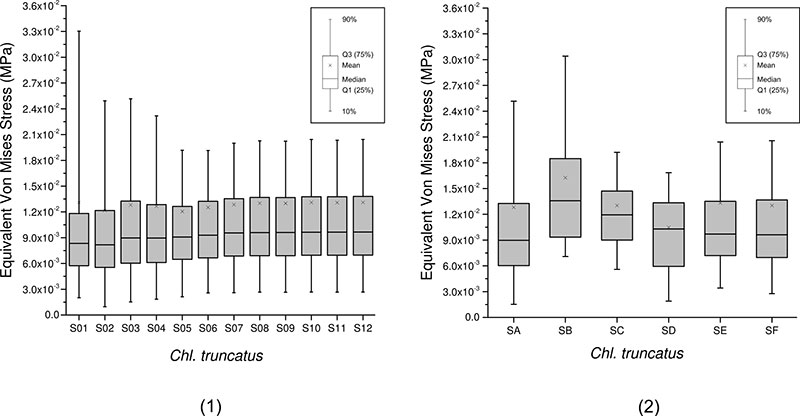
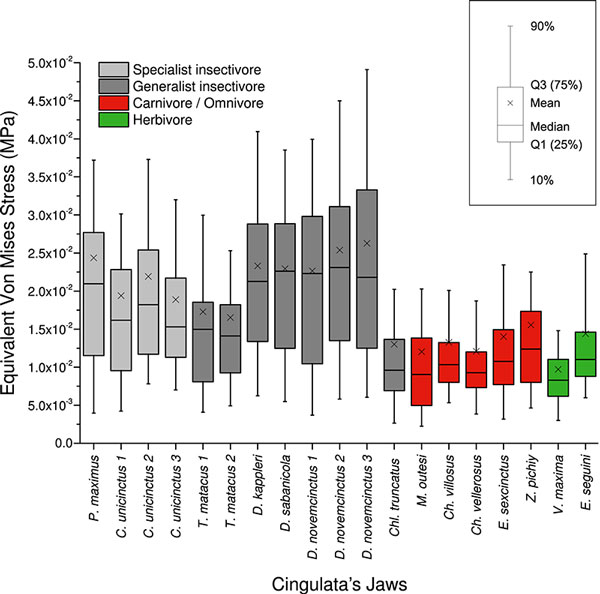
FIGURE 6. Box-plots of Von Mises stress distributions when Quasi-Ideal Meshes (QUIM) are assumed for the 20 Cingulata mandibles analysed. The 80% of the values of the Von Mises stress distribution are represented between the upper and lower whiskers.