FIGURE 1. The localities included in this study from England and Ireland (1.1) and from Germany (1.2). The maps (1.1) and (1.2) are not to the same scale.
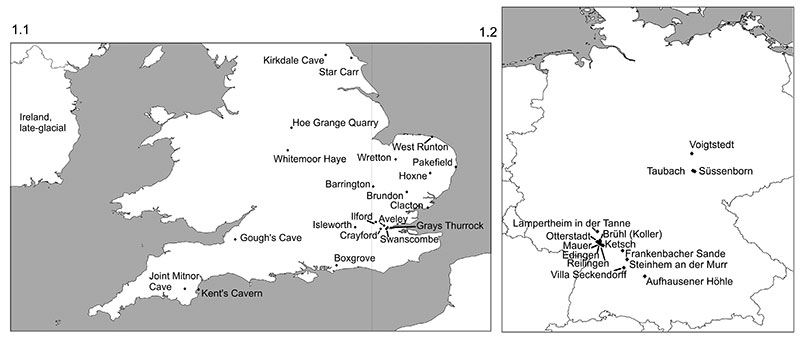
FIGURE 2. Linear regressions of mean mesowear values of the ungulates in the local palaeocommunities and NAP % in the pollen records of the localities with (1.1.) minimum NAP %, (1.2.) maximum NAP % and (1.3.) mean NAP %.
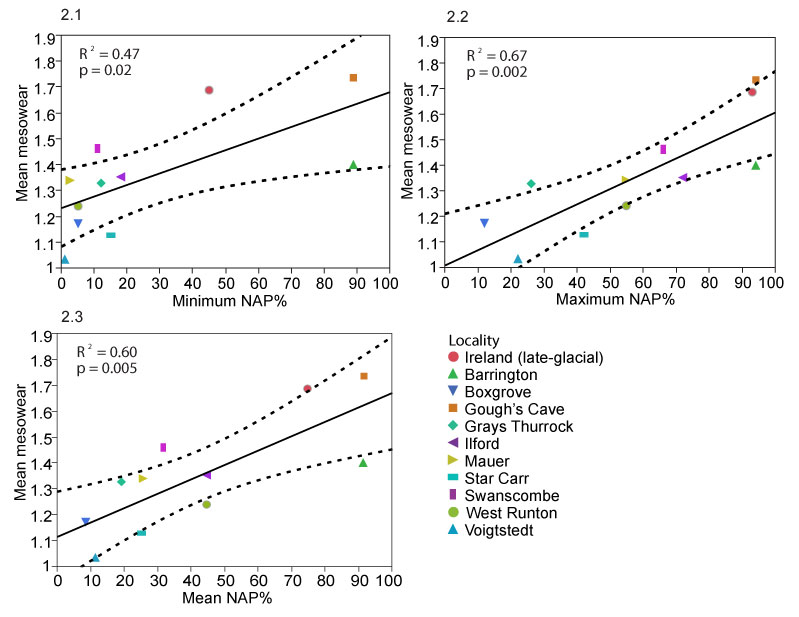
FIGURE 3. Linear regressions of mean mesowear values of deer (Cervidae) from localities with pollen records, and minimum, maximum and mean NAP % in the pollen records of the localities. Numbers of specimens per locality are given in brackets after the locality names. For Megacerini, the samples from Grays Thurrock and Ireland are Megaloceros giganteus ; those from Boxgrove, West Runton and Voigstedt combine Praemegaceros verticornis, P. dawkinsi and Megaloceros savini. For Dama the specimens from Boxgrove are D. cf. roberti ; others are D. dama.
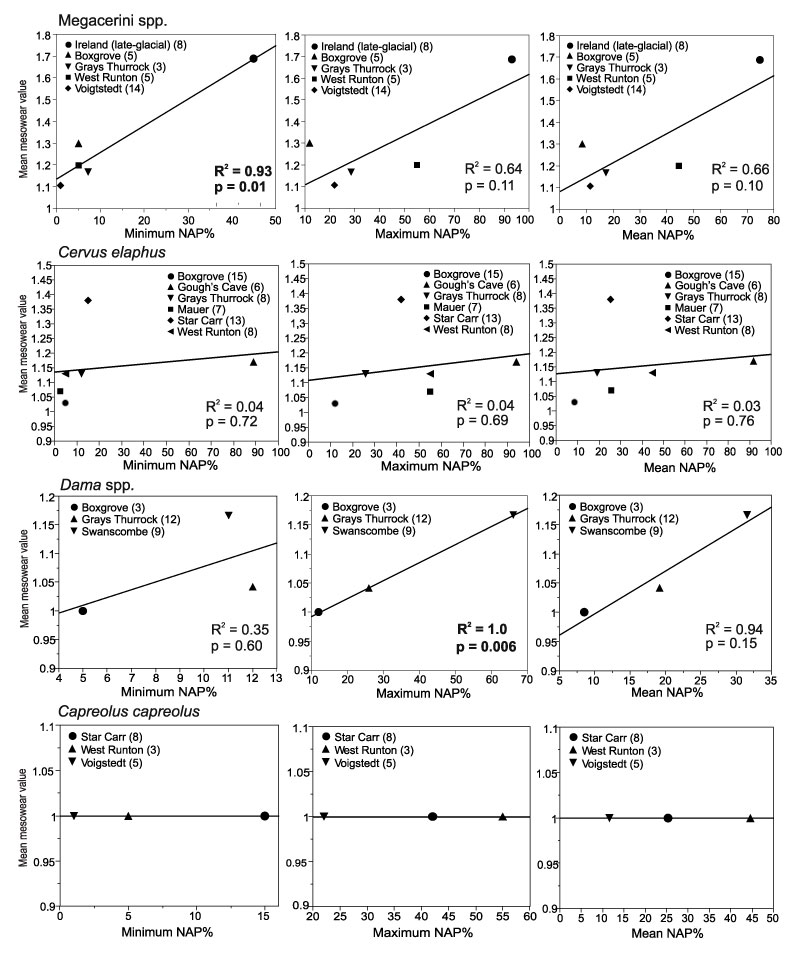
FIGURE 4. Linear regressions of mean mesowear values of Bovidae, Equus ferus and Rhinocerotidae from localities with pollen records, and minimum, maximum and mean NAP % in the pollen records of the localities. Numbers of specimens per locality are given in brackets after the locality names. Bison from Mauer is B. schoetensacki ; from other localities, B. priscus.
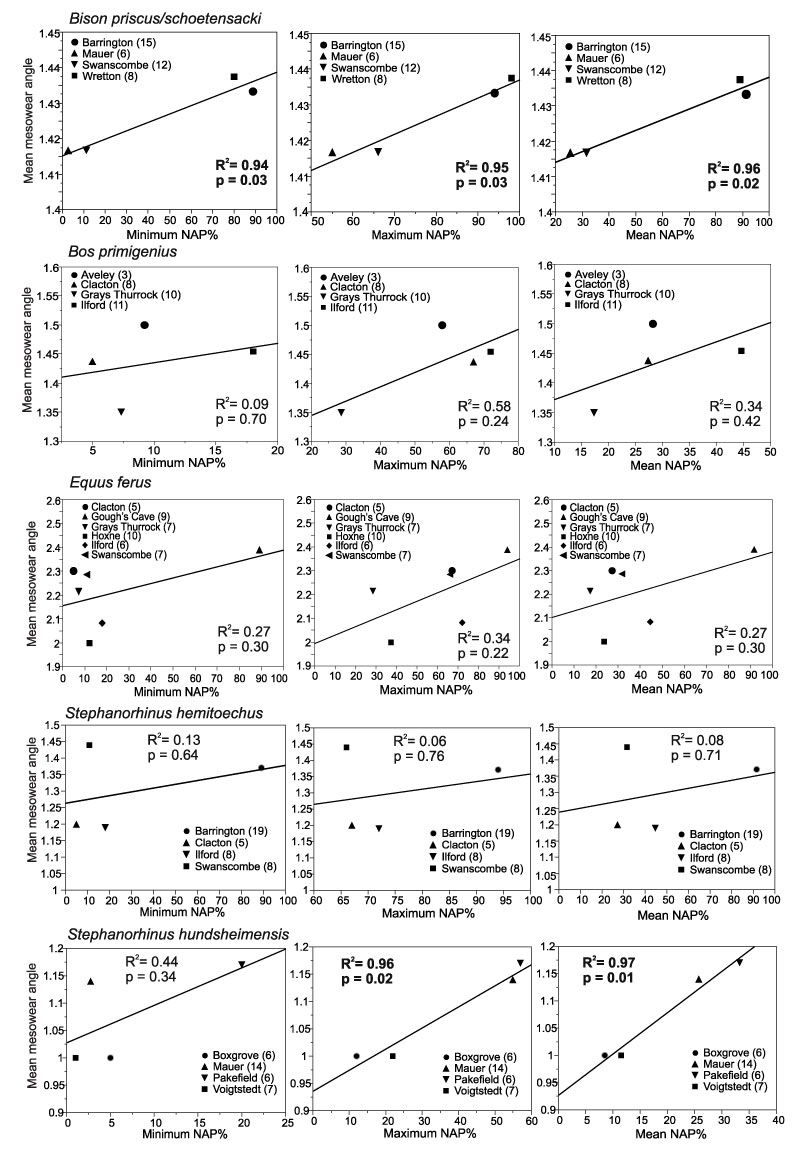
FIGURE 5. Linear regressions of body mass (kg) of deer (Cervidae) from localities with pollen records, and minimum, maximum and mean NAP % in the pollen records of the localities. Each point represents an individual specimen. Numbers of specimens per locality are given in brackets after the locality names.
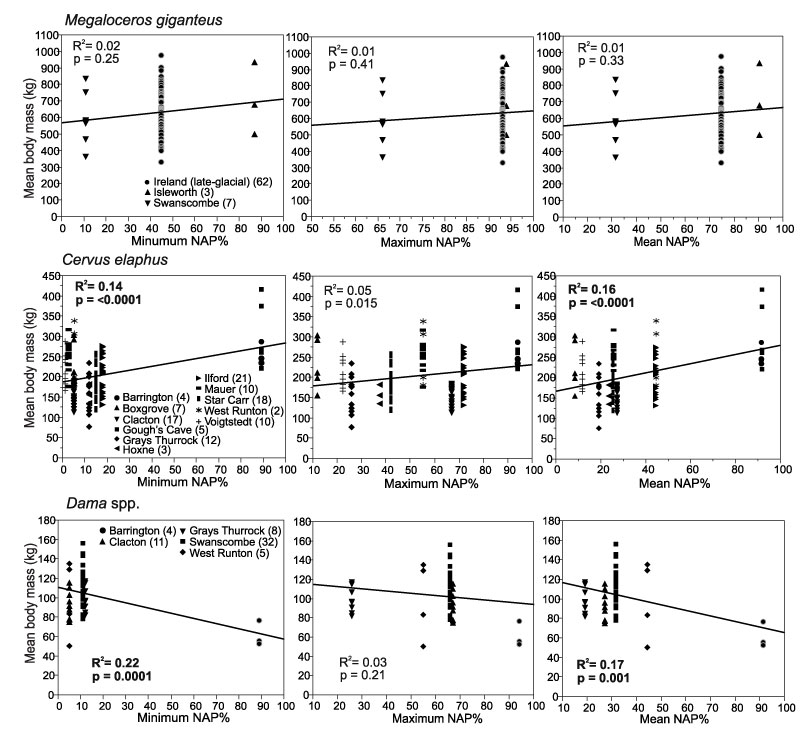
FIGURE 6. Body mass of Cervus elaphus, Dama spp. and Capreolus capreolus in Middle and Late Pleistocene localities from Britain and Germany. The localities are arranged from oldest (right) to youngest (left) estimated age. The middle line in the diamonds marks the mean body mass and the upper and lower lines mark the 95% confidence limits of the mean. Diamonds that do not overlap at the 95% lines indicate statistically significant difference between populations. The central line in the figures indicates the combined mean body mass of all the populations. The individual body mass estimates of each specimen are shown as data points. Sample sizes are given in brackets for each locality.
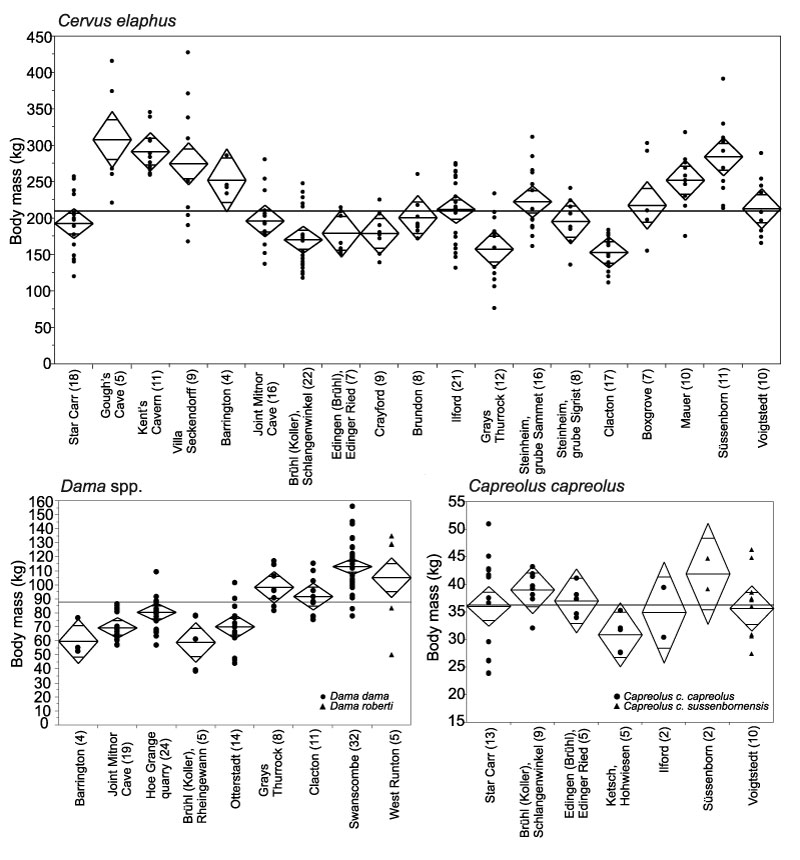
FIGURE 7. Body mass of Megacerini, Rangifer tarandus and Alcini in Middle and Pleistocene localities from Britain and Germany. For explanation of graph, see Figure 6.
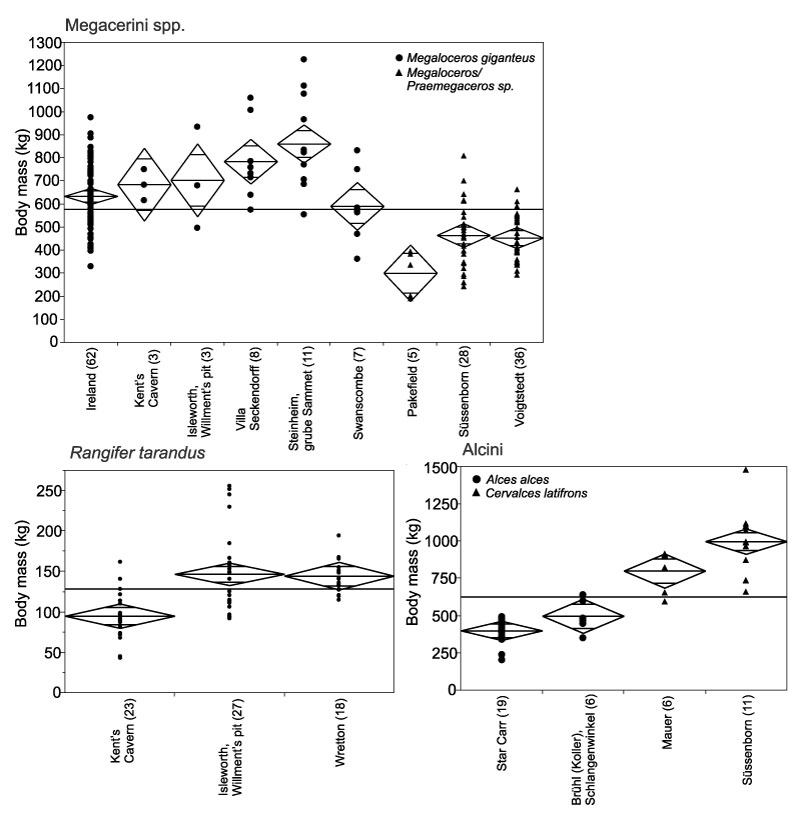
FIGURE 8. Body mass of Rhinocerotidae from Pleistocene localities of Britain and Germany. For explanation of graph, see Figure 6.
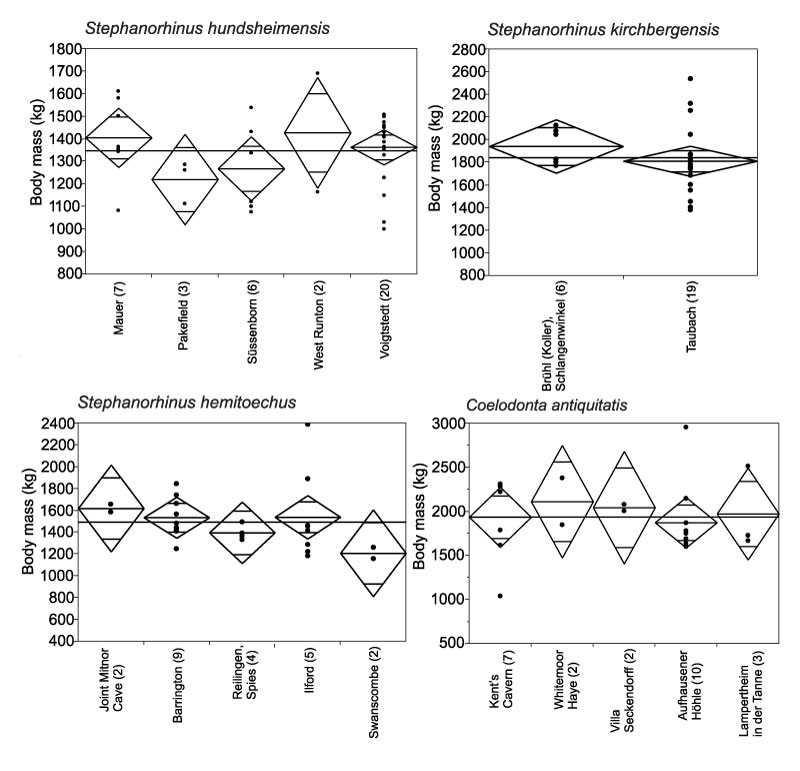
FIGURE 9. Linear regressions of body mass (kg) of Bovidae and Equus ferus/mosbachensis from localities with pollen records, and minimum, maximum and mean NAP % in the pollen records of the localities. Each point represents an individual specimen. Numbers of specimens per each locality are given in brackets after the locality names.
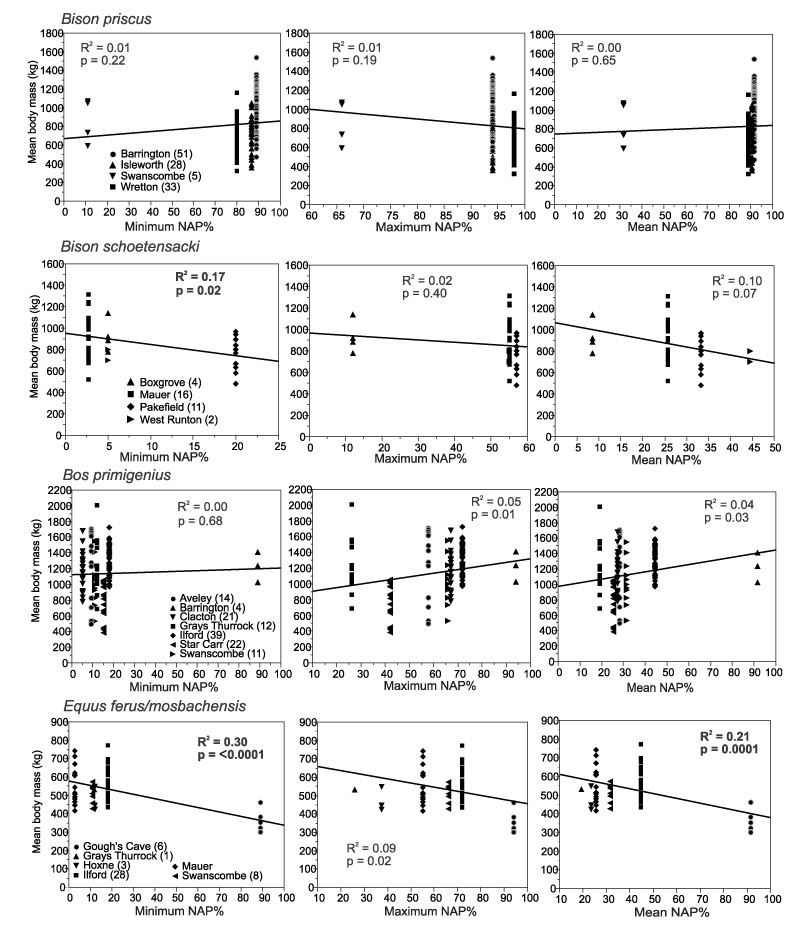
FIGURE 10. Body mass of bovine Bovidae (Bison priscus and Bos primigenius) from Middle and Late Pleistocene localities of Britain and Germany. For explanation of graph, see Figure 6.
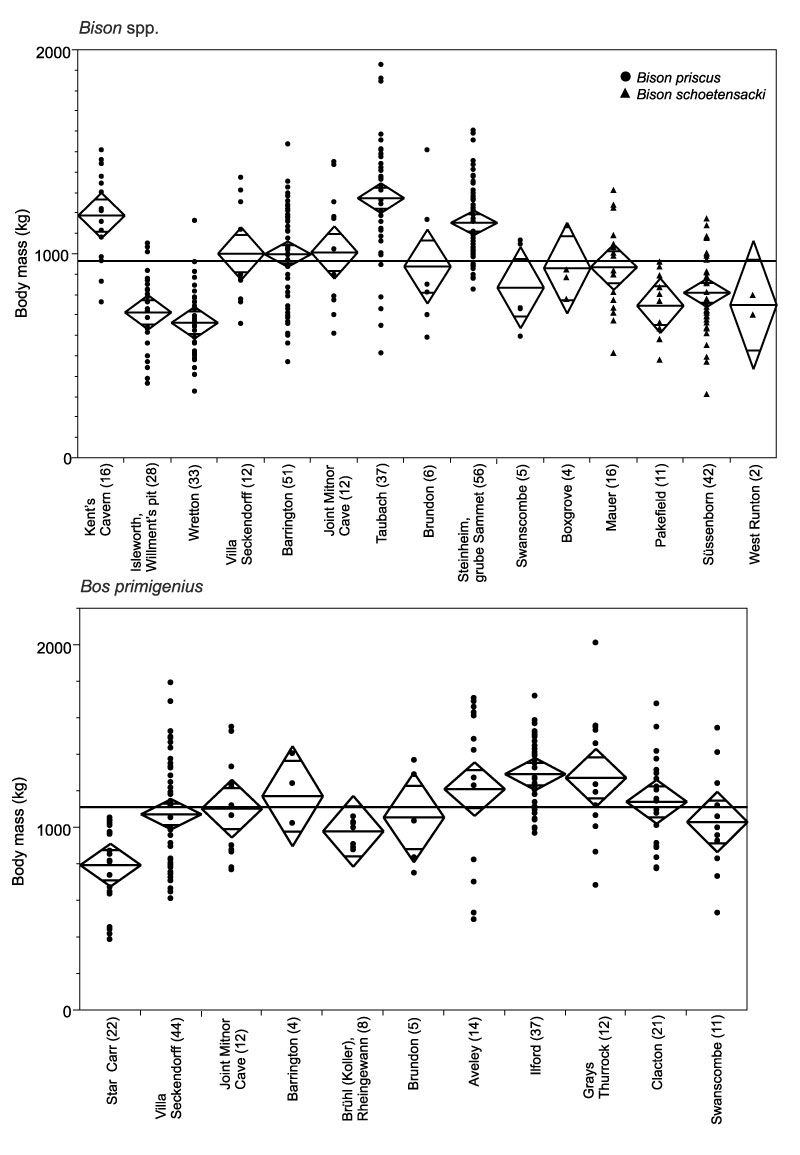
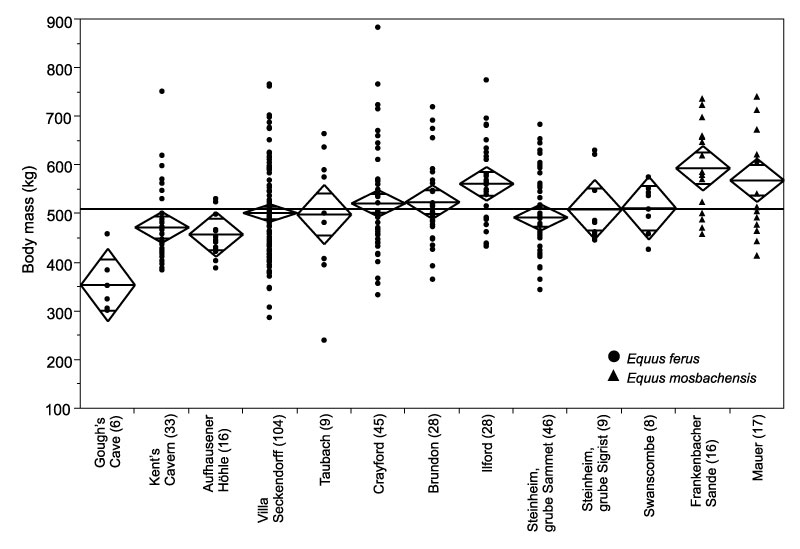
FIGURE 11. Body mass of caballine Equidae (Equus ferus and E. mosbachensis) in Middle and Late Pleistocene localities from Britain and Germany. For explanation of graph, see Figure 6.