FIGURE 1. 1, Landmark configuration on schematic osteoderm of Eutatus; landmarks (dark gray circles) and semi-landmarks (white circles); 2, Box-and-whisker plot showing centroid sizes of E. seguini, E. pascuali and E. crispianii. The central bar of each box represents the median of the population, while upper and lower bounds are 75th and 25th percentiles, respectively. Boxes show 50 % of the population and whiskers extend showing the minimum and maximum values in a range of 1.5 times the length of the box. Circles mark the atypical values of CS located beyond to 1.5 times the box length distances.
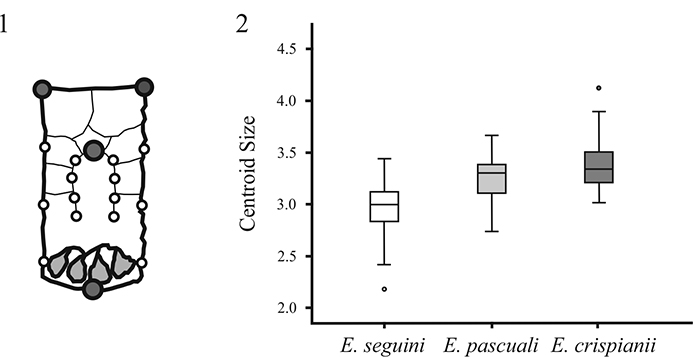
FIGURE 2. 1, Fixed osteoderms of Eutatus crispianii sp. nov. MGPV-E1; 2, E. seguini MACN10160a; 3, E. seguini MACN2772; 4, E. pascuali MMP1212. af, anterior foramina; facf, foramina around the central figure.
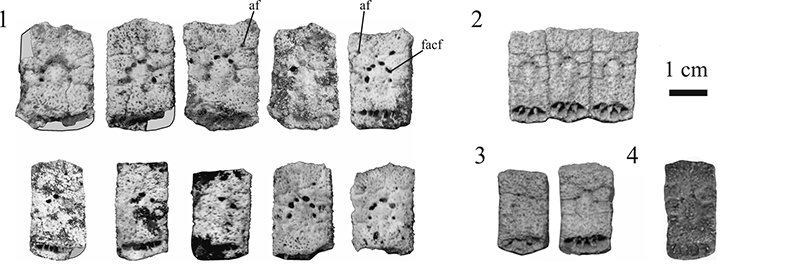
FIGURE 3. Bivariate plot showing relationship between the width and length of fixed osteoderms of E. crispianii sp. nov. (black circles), E. seguini (white circles) and E. pascuali (red circles).
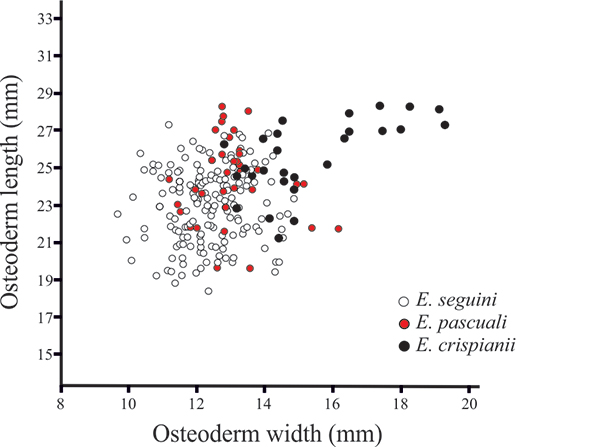
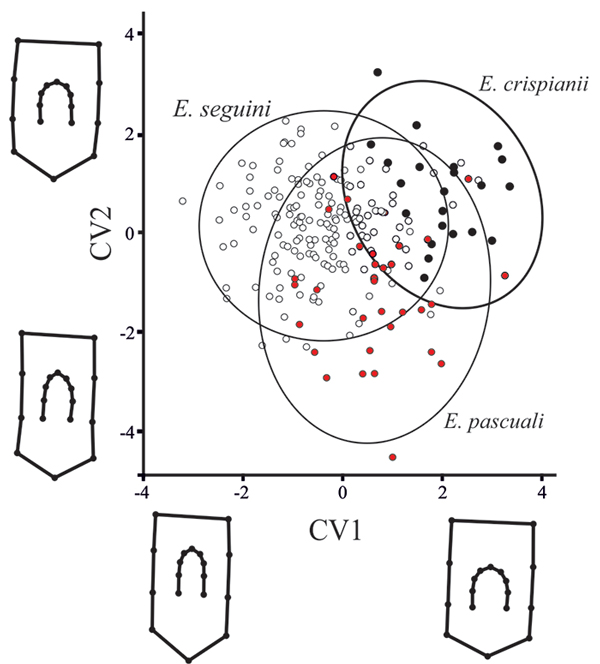
FIGURE 4. Scatterplot (CV1 versus CV2) from Canonical Variate Analysis of osteoderms of Eutatus. Shape change across axes is represented as wireframe for the positive and negative values. 95 % confidence ellipse for E. seguini, E. pascuali and E. crispianii sp. nov. are shown. E. crispianii sp. nov. (black circles), E. seguini (white circles) and E. pascuali (red circles).