

 Cranial morphometrics of the dire wolf, Canis dirus, at Rancho La Brea: temporal variability and its links to nutrient stress and climate
Article number: 17.1.17A
https://doi.org/10.26879/437
Copyright Society for Vertebrate Paleontology, April 2014
Author biographies
Plain-language and multi-lingual abstracts
PDF version
Submission: 4 November 2013. Acceptance: 1 April 2014
{flike id=723}
ABSTRACT
The tar pits of Rancho La Brea are a unique window onto the biology and ecology of the terminal Pleistocene in southern California. In this study we capitalize on recent advances in understanding of La Brea tar pit chronology to perform the first morphometric study of crania of the dire wolf, Canis dirus, over time. We first present new data on tooth fracture and wear from pits dated older than heretofore analyzed, and demonstrate that fracture and wear events, and the increased competition and heightened carcass utilization they are thought to represent, were of varying intensity across the sampled time intervals. Skull size, and by extension body size, is shown to differ significantly among pits at La Brea, with the strongest single observation being reduction in body size at the last glacial maximum. Skull size variation is shown to be a result of both ontogenetic and evolutionary factors, neither of which is congruent with a temporal version of Bergmann's rule. Skull shape difference among the pits is also significant, with shape variability attributable to both neotenic effects in populations with high breakage and wear, and evolutionary changes possibly due to climate change. Testing of this hypothesis requires better accuracy and precision in La Brea carbon data, a program that is within the reach of current AMS dating technology.
F. Robin O''Keefe. Associate Professor, Department of Biological Sciences, Marshall University, One John Marshall Drive, Huntington, West Virginia 25701, USA, okeefef@marshall.edu
Wendy J. Binder. Associate Professor, Department of Biological Sciences, Loyola Marymount University, One LMU Drive, MS 8220, Los Angeles, California 90045, USA, Wendy.Binder@lmu.edu
Stephen R. Frost. Associate Professor, Department of Anthropology, Condon Hall 353, 1218 University of Oregon, Eugene, Oregon 97403, USA, sfrost@uoregon.edu
Rudyard W. Sadlier. Assistant Professor, Department of Biological Sciences, Saint Xavier University, 3700 West 103rd Street, Chicago, Illinois 60655, USA, rudyardw@gmail.com
Blaire Van Valkenburgh. Professor, Department of Ecology and Evolutionary Biology, University of California Los Angeles, Terasaki Life Sciences 2163, 610 Charles E. Young Drive East, Los Angeles, California 90095, USA, bvanval@ucla.edu
Keywords: dire wolf; Rancho La Brea; cranial morphometrics; Pleistocene; evolution
Final citation: O'Keefe, F. Robin, Binder, Wendy J., Frost, Stephen R., Sadlier, Rudyard W., and Van Valkenburgh, Blaire 2014. Cranial morphometrics of the dire wolf, Canis dirus, at Rancho La Brea: temporal variability and its links to nutrient stress and climate. Palaeontologia Electronica Vol. 17, Issue 1;17A; 24p. https://doi.org/10.26879/437
palaeo-electronica.org/content/2014/723-canis-dirus-craniometrics
INTRODUCTION
Background
The promise of the La Brea tar pits as a window into the mammalian communities of the terminal Pleistocene has been obvious for decades. Intensive collection at intervals during the past century has resulted in the recovery of thousands of well preserved mammalian bones, invertebrates, and plant remains (Stock and Harris, 1992). The fossils occur in a series of open asphalt seeps that acted as episodic animal traps (Quinn, 1992). Carnivores are disproportionally represented in the deposits, comprising about 90% of all fossils (Stock and Harris, 1992). The dire wolf Canis dirus is the most common fossil carnivore in the deposits. The pit deposits range in age from over 50,000 to less than 10,000 years (O'Keefe et al., 2009). The taphonomy of the deposits is complex, with significant post-depositional fossil movement due to asphalt turbation (Friscia et al., 2008). The length of the depositional window for each pit is also poorly constrained in most cases, due to a lack of intensive carbon dating in most pits, and measurement and calibration error of the dates that do exist.
However, the broad outlines of depositional chronology at Rancho La Brea are well understood (O'Keefe et. al, 2009; Meachen et al, 2014). Deposits of varying ages bracket the Pleistocene- Holocene transition (Bølling-Allerod interval, Petit et al., 1999), the Younger Dryas cool interval, the Oldest Dryas cold interval, and preceding climate intervals (Kennet et al., 2008; see Table 1). The American megafaunal extinction interval is also included, a time when 90 genera of mammals weighing 44 kg or more disappeared (circa 13,000 ybp; Lyons et al., 2004; Koch and Barnosky, 2006). This event is approximately coincident with the onset of the Younger Dryas (Kennet et al., 2008) but its duration and causality are contentious (Koch and Barnosky 2006; Gill et al., 2009). The fossil assemblage at Rancho La Brea therefore accumulated over an eventful time in Earth's climatic and ecological history. This paper capitalizes on the large amount of La Brea dire wolf material, and the temporal variation of its deposition, to explore the response of the resident dire wolf population to various biotic and abiotic forcing factors. Data used in this investigation include dental fracture and wear, and a morphometric data set comprising 27 3D cranial landmarks.
Previous Research
Radiocarbon Dating. Dating of the La Brea tar pits is possible via 14C dating. A total of 209 dates from the various pits have accumulated over the past 25 years (Marcus and Berger, 1984; O'Keefe et al., 2009). Unfortunately, stratigraphic position is a poor indicator of age due to ongoing asphalt turbation (Stock and Harris, 1992; Friscia et al., 2008). A large number of dates are therefore needed to characterize the depositional interval represented by each pit deposit. Past dating efforts have been uncoordinated, and some pits have well-characterized age distributions while most have few dates. Based on previous dating work, it is clear that 1) pit deposition was episodic; 2) different pits have different ages; 3) some pits may have wider age ranges than others; and 4) depositional histories in some pits are complex, recording multiple pulses of entrapment of varying intensity (O'Keefe et al., 2009). The mean dates of deposition, and sample sizes for all analyses in this paper, are listed in Table 1.
Stable Isotope Analysis. Stable ratios in the isotopes of C and N may be used to discriminate between C3- and C4-dominated diets in herbivores, differences that propagate into the carnivores that consume them. Such data from a range of La Brean floral taxa show variability in N and C values in plant communities (Coltrain et al., 2004), in accord with community structure variability documented in marine sediment cores (Heusser and Sirocko, 1997; Heusser, 1998; Kennett et al., 2008). Changes in the floral community are reflected in both herbivore and carnivore isotopic values as the climate became more xeric at the end of the Pleistocene (Fox-Dobbs et al., 2006). Isotopic fractionation in the recent wolf Canis lupus has also been used to predict the diet of dire wolves (Fox-Dobbs et al., 2007). These authors find that dire wolves were relatively generalized in their utilization of large prey animals. The climate in the Los Angeles basin became markedly warmer and drier as the LGM proceeded into the Holocene, directly impacting plant community structure; this is observable as changing isotopic ratios higher in the food web, in both carnivores and herbivores. However, the possible impact of this climate change on carnivore morphology, if any, has not been investigated.
Tooth Fracture and Wear. Another aspect of temporal biotic variation quantified at Rancho La Brea is the rate of tooth fracture and wear in large carnivores (Van Valkenburgh and Hertel, 1993; Binder et al., 2002; Binder and VanValkenburgh, 2010). Tooth fracture frequency is positively correlated with tooth wear, and both are associated with higher rates of bone consumption in terrestrial carnivorans, both among and within species (Van Valkenburgh, 1988, 2009; Meloro, 2012). Increased bone consumption is associated with nutrient stress because carcasses are consumed more completely when prey are difficult to acquire, due to primary productivity reductions and/or an increase in intra- and interspecific competition. Large-bodied, North American Pleistocene carnivores, such as dire wolves, sabertooth cats, and lions, all had significantly elevated rates of tooth fracture relative to their modern counterparts, suggesting a greater intensity of interspecific competition in Pleistocene communities (Van Valkenburgh, 2009; Meloro, 2012). At Rancho La Brea, dire wolves exhibit fracture frequencies that vary significantly over time, suggesting fluctuating levels of food stress. Binder et al. (2002) found that wolves collected from Pit 13 (deposition circa 17.9 ca kbp, see below; see also Binder and VanValkenburgh, 2010), showed significantly higher wear and fracture than those from Pit 61/67 (circa 13.8 ca kbp), indicating that nutrient stress was not extreme just prior to the mass extinction of Canis dirus.
Shape Change. Early morphometric studies at Rancho La Brea, on both Canis dirus (Nigra and Lance, 1947) and Smilodon (Menard, 1947), document chronological changes in body size. A recent body of work (summarized in Prothero et al., 2012) has failed to identify size or shape change across pits at La Brea in a variety of taxa. However, this work utilized simple linear metrics and ratios of postcranial elements, rather than more robust size and shape estimators based on landmark data. It may therefore lack the precision to capture subtle size or shape change in some taxa, although the observed stasis may be real in others. Landmark-based geometric morphometric analyses of individual species is at an early stage, but Meachen et al. (2014) document significant size and shape variability over time in the jaw of the sabertooth cat Smilodon fatalis. Carnivore community composition can also impact carnivore morphology; the presence of other carnivores can drive dental character displacement in a range of species (Dayan, 1992; Dayan and Simberloff, 1998). Recent work by Meachen and Samuels (2012) documents this effect at La Brea, finding stasis in C. lupus but change in C. latrans across the Pleistocene/Holocene transition. Detailed geometric morphometric analysis of shape and size change across the carnivore guild at La Brea has yet to be attempted.
Experimental Design
All large-sample metric analyses from La Brea are based on—and test—the premise that pooled fossils from each pit will display a coherent morphological signal. This in turn assumes that the rate of fossil deposition was rapid with respect to the rate of morphological change. The observation that isotopic ratios in different pits do vary, and vary in a coherent way with known shifts in vegetation, suggests this approach is valid (Coltrain et al., 2004). Additionally, observed differences in fracture and wear indicate that the amount of geological time averaging is small relative to the duration of the factors driving this phenomenon. However, the premise that depositional time is short relative to the rate of morphological change is significant and should be tested (see below). Also, more and better radiocarbon dates from the La Brea system should help greatly in constraining pit depositional parameters independent of intrinsic biotic factors.
Hypothesis 1: Temporal Invariance. The fundamental null hypothesis in this study is stasis in dire wolf skull shape among pits at Rancho La Brea, either because the species did not vary over time, or because the pits are too time-averaged to show deviations from the temporal mean. Given that fracture and wear values, isotopic values, and body size in Canis dirus are known to vary among pits (Nigra and Lance, 1947), it seems likely that shape will also vary, begging the question of what types of shape changes might be observed. However, at the outset the null hypothesis that all measured parameters—tooth fracture and wear, size, and shape—are invariant with respect to time at La Brea must be tested, particularly given the finding of widespread stasis by Prothero et al. (2012).
Hypothesis 2: Sexual Dimorphism. This hypothesis and the ones following it are based on the assumption that temporal and biologic trends in the covariance structure of dire wolves will resemble geographic and biologic trends in the covariance structure of Canis lupus and other recent canids. Knowledge of the covariance structure of extant gray wolf crania has recently improved (O'Keefe et al., 2013) and is a good source of testable hypotheses. The first axis of covariation in the C. lupus data set is strongly correlated with size, and sexual dimorphism is the single most powerful factor underlying this axis (O'Keefe et al., 2013). Sexual dimorphism should also be a relatively strong factor in the covariance structure of dire wolves at La Brea, an inference supported by the fact that sexual dimorphism in C. dirus was of similar magnitude to that observed in modern canines (VanValkenburgh and Sacco, 2002). We predict that sexual dimorphism should be readily identifiable in the dire wolf covariance structure, and should consist of size and associated shape variation similar to that in C. lupus, where females are smaller but have relatively larger molars than males. We also predict that sexual dimorphism should be constant among pits, assuming that sexual dimorphism is constant over time, and that all pit samples have equal sex ratios.
Hypothesis 3: Bergmann's Rule. We predict that size should be inversely correlated with temperature, in a temporal version of Bergmann's rule. Recent research demonstrates that many mammals are responding to anthropogenic warming by reducing body size (Gardner et al., 2011). However, a range of work in carnivores has found that species that do follow the rule (and many do not, Giest, 1987) are responding to changes in resource availability (McNab, 2010) rather than to change in temperature as Bergmann originally suggested (Ashton et al., 2000). However, the factors underlying Bergmann's rule are inferred a posteriori to a mathematical statement concerning correlation between body size and temperature. This correlation can and should be tested, even though its interpretation is open to debate.
Gray wolves clearly follow Bergmann's Rule, with body size increasing with latitude and hence decreasing temperature (O'Keefe et al., 2013). However, the geographic range of the wolves in O'Keefe et al. (2013) encompasses about 45° C of mean annual temperature variation, while the temperature variation at La Brea is about 10° (NGRIP, 2004; Coltrain et al., 2004). Therefore size decrease might be seen only in the youngest dire wolves, those deposited (in pit 61/67) at a time when temperatures where about 7° warmer than the LGM, and about 5 degrees warmer than pits deposited further back in time. Support for this hypothesis comes from the Canis lupus fossil record; gray wolves from the late Rancho La Brean in the Santa Barbara basin are massive and robust, and possibly convergent with dire wolves (Nowak, 1979; Goulet, 1993). Moving into and through the Holocene, large gray wolves most akin to the far northern C. l. arctos are replaced by smaller, possibly more warm-adapted, animals in the basin (Nowak, 2003). We hypothesize a similar transition in dire wolves during the marked warming between the LGM and their extinction during the Holocene warm period.
Hypothesis 4: Ontogenetic Impacts of Nutrient Stress. There are several potential impacts that high-stress intervals might have on the size and shape of dire wolf crania. The first is no effect at all. If periods of stress were very ephemeral, there will be no time for increased stress to influence the size or shape of a population. At slightly longer time scales, where nutrient stress acts over sufficient time to impact the ontogeny of growing wolves, we would expect the population to display neotenic features. As pointed out by Klingenberg (2010), this ontogenetic affect should be visible in adult wolves, because epigenetic stresses during development directly affect adult shape. The covariance structure of the gray wolf sample in O'Keefe et al. (2013) also carries a strong axis of ontogenetic allometry; however, this axis is confined to late-stage somatic growth, after the onset of dental maturity. That gray wolf data, and the dire wolf data set reported here, both concern only animals that are dentally adult. However, dental maturity is attained in dogs at seven to nine months, while full somatic growth can take up to two years (Kreeger, 2003; Hawthorne et al., 2004).
This late-stage somatic allometry is identifiable as the second axis of covariation in the gray wolf (O'Keefe et al., 2013). On it, the teeth remain constant while the non-dental (somatic) parts of the skull grow up around them. This axis is not correlated with other factors in gray wolves; however, in dire wolves, we may predict that populations under high nutrient stress would display neoteny along such an axis. Importantly, this neoteny would comprise size decrease lacking a strong shape component, because the strong allometries in dog ontogeny are confined to the early, rapid phase of maturation in dogs (and in tetrapods generally, Goodrich, 1930). A corollary prediction is that tooth shape should not vary with late-stage neoteny. Populations under nutrient stress during only late stage growth should fail to grow up around their adult teeth, and therefore vary in somatic size but not dental size or somatic shape.
Hypothesis 5: Evolutionary Impacts of Nutrient Stress. Finally, the possibility exists that episodes of increased nutrient stress operate over evolutionary time scales, on the order of 102 years or more. One hundred years is a short period geologically and is less than the error inherent in all La Brea carbon dates (O'Keefe et al., 2009). However, a wolf population might pass through 20 generations in this time, affording adequate time for microevolution. We hypothesize that elevated nutrient stress over evolutionary time scales may drive modifications in craniodental morphology that enhance bite force. The ability to crack bones and fully consume carcasses is likely to select for stronger bite forces (Tseng and Wang, 2010). These modifications might include enlarged areas of jaw muscle attachment, shortening of the snout, and other alterations of skull shape that improve mechanical advantage of the masseter (most active in crushing at the molar table) at the expense of the temporalis (more active in shearing at the carnassial blades). We might expect these differences in wolves from pits displaying high fracture and wear frequencies, either from epigenetic or genetic responses, or both.
MATERIALS AND METHODS
Data and Analysis
The Canis dirus data collected for this paper are of two kinds. The first is a survey of tooth fracture and tooth wear from four pits of different ages. The second set is three-dimensional landmark data collected from complete or nearly complete crania from the same pits. Data were taken from four pits of different ages, 61/67, 13, 2051, and 91, which date to successively older times of deposition (O'Keefe et al., 2009; Table 1). The pit 2051 sample is from the collection that now resides in the University of California, Berkeley (UCMP); all other material is housed in the collection of the Page Museum, Los Angeles, CA. In all pits with sufficient dates to document it (those included here and others, O'Keefe et al., 2009) there is a tall central peak of deposition surrounded by a leptokurtic distribution of other dates. We take the peak of maximum deposition as our age in this study. In doing so we assume that the age outliers will be uncommon, and that a random sample of crania should originate from near the mean age (Meachen et al., 2014). Lastly, the dates of the two youngest pits in this study are dated from only four (61/67) and five (13) dates; we therefore have only a general idea of the time of deposition of these deposits (Table 1).
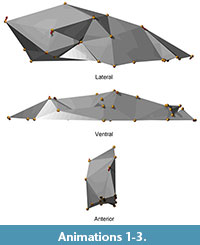 Differences in tooth fracture and wear are tested among pits via Wilcoxon non-parametric tests between means. Size and shape are analyzed from the morphometric data using Generalized Procrustes superimposition with the extraction of centroid size, followed by principal components analysis of the resulting transformed landmark coordinates (Zelditch et al., 2004). An ANOVA of centroid size is performed to identify differences in size among pits. Second, differences in shape are evaluated among pits. The magnitude of shape differences between pits is measured as the Procrustes distances among pit mean shapes (Bookstein, 1991). Our global tests for significant differences among pits comprise a non-parametric permutation test of significant differences between pits, and a set of ANOVAs on the first five principal component scores of the Procrustes superimposition coordinates. Qualitative visualization of mean landmark positions among pits is accomplished using an animation that shows the movement of each landmark mean from one pit to another (Animations 1, 2, and 3). Visualization of shape change along the first four principal components is accomplished by animations that deform the global landmark shape along each component.Lastly, distances along wireframes connecting the landmarks were also calculated and analyzed.
Tooth Fracture and Wear Analysis
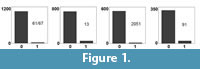 All well preserved cranial and mandibular specimens of Canis dirus in pits 61/67, 13, 2051, and 91 were examined. The total number of teeth examined for breakage was 2852, with several hundred teeth available for each pit (Table 1; Figure 1). Teeth were counted as broken only if they showed evidence of subsequent wear in life in the form of distinct wear facets formed by tooth-tooth or tooth-food contact (Van Valkenburgh and Hertel, 1993; Binder et al., 2002).
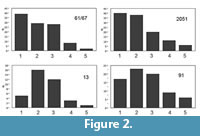 Tooth wear stage was determined by visual inspection and individuals were classified from 1 to 5, from least to most worn. A similar classification was used in Van Valkenburgh (1988) and Binder et al. (2002) and produced consistent results with different observers, though all observations for this analysis were taken by one person (WB). The analysis of tooth wear involved a subset of all of the teeth in the pits, given the stringent requirements necessary for reliable measurement (Table 2; Figure 2). Differences in tooth fracture and wear are tested among pits via Wilcoxon non-parametric tests between means (Table 3).
Cranial Shape Analyses
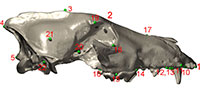
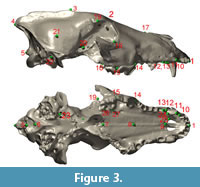 To quantify cranial shape, we used three-dimensional landmark data collected from crania from the four pits based on 27 cranial landmarks (Table 4; Figure 3). Sample size was limited due to the requirement for complete or nearly complete hemicrania. A total of 73 mostly complete skulls of Canis dirus were used in this study (Table 1). Skulls were included if at least one side of the skull possessed all of the landmarks of interest; the zygomatic arches of C. dirus skulls are seldom complete at La Brea, so landmarks from this region were not included. Landmarks associated with teeth were measured at the alveolus, so that missing teeth did not prevent use of a skull. Prior to digitizing, each skull was placed in a sandbox so that it presented in left or right lateral view, and landmarks were recorded using the touch stylus of a G2 Microscribe digitizing arm linked to a laptop computer. All landmark data were collected by FRO. Left hemicrania were mirrored to right hemicrania to allow use of both sides in the same analysis. All statistical tests were done on these hemicrania; some of the visualizations presented below depict entire crania.
The landmark configurations then underwent Procrustes superimposition with scaling in Morphologika (O'Higgins and Jones, 1990, 2006). The Morphologika output comprises a centroid size measure for each skull, as well as a recalculated set of landmarks that are scaled to unit centroid size and superimposed after rotation and translation (Bookstein, 1991; Zelditch et al., 2004). These shape coordinate data were then used for further statistical analysis of shape. Shape variance is explored by using variation in individual landmark position (intralandmark variation), calculation and visualization of principal components, Procrustes sums of squares to calculate percentage of vari- ance related to size and differences in pit shape (Frost et al., 2003), and analysis of distances among landmarks (interlandmark variation / tradi- tional morphometrics; Marcus, 1990).
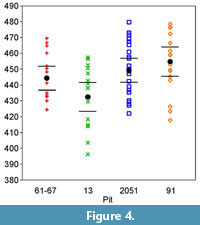 Differences in mean centroid size among pits were examined with ANOVA (Table 5; Figure 4). Centroid size was not logged before this test; log transformation is usually not necessary with morphometric data involving adults (Jungers et al., 1995). Exploratory analysis with log-transformed data show that the results do not differ for size or shape analyses. The hypothesis of homogeneity in shape is tested among pits using a non-parametric permutation test on Procrustes distance (Table 6 and Table 7). A global MANOVA followed by pairwise Hotelling's T2 calculations was also performed, and many of the landmarks showed highly significant differences among pit means. However, given the small sample sizes involved and the large number of unplanned comparisons, we fear this test is vulnerable to Type 1 error, and therefore rely on the nonparametric permutation test to establish the fact that the mean landmark configurations do vary among pits.
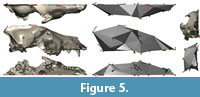 Exploration of shape differences among pits is complicated by the fact that the covariance matrix of shape coordinates is singular because we have 73 skulls but 81 variables (27 landmarks times three coordinates; illustrated in Figure 5). Canonical variates analysis (CVA) cannot be performed on a singular covariance matrix; the usual solution to this problem is to perform a dimensionality reduction via PCA before performing the CVA (Krzanowski et al., 1995). This results in a CVA of principal components, whose utility is dependent on the successful interpretation of those components. Rather than add this layer of complexity, our approach is to interpret the components and then run ANOVAs on them by pit.
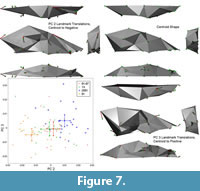
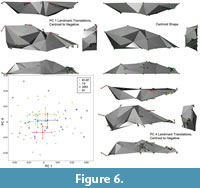 This approach is also statistically conservative, because no a priori information on pit membership is used to construct the ordination. We explore how the configurations vary parametrically, with a set of ANOVAs on the first five principal component scores of the Procrustes shape coordinates (Table 8; Figure 6 and Figure 7). Visualization of mean landmark differences among pits is accomplished using an animation that shows the movement of each landmark along its vector from one pit to another. In addition, visualization of shape change along the first four principal components is accomplished by animations that depict the global landmark shape along each component. Lastly, in some cases, distances between landmarks were also calculated and analyzed (Table 9; Figure 8 and Figure 9). Interlandmark distances are Mossiman shape variables (Mosimann and Malley, 1979) and are useable in parametric statistics.
RESULTS
Fracture and Wear
 Statistical assessment via Wilcoxon nonparametric one-way ANOVA of the tooth fracture data (Table 3) shows that the pits fall into two groups, a high fracture group (13, 91) and a low breakage group (61/67, 2051; Table 3; Figure 1). The large sample numbers afford great statistical power, and differences in mean breakage are highly significant between, but not within, the two groups. The results of the wear analysis are similar. The pits again fall into two groups, a high-wear group (13, 91) and a low wear group (61/67, 2051; Table 3; Figure 2). Three of the tooth wear mean comparisons were significant at p < 0.05; the 13-2051 comparison is not significant but is close (p < 0.0735). This lack of significance may be due to a lack of precision inherent in the small sample size for pit 13 (n = 37), rather than a lack of difference between the means of pits 13 and 2051. The signal in these data is unambiguous, demonstrating a high fracture and wear group and a low fracture and wear group. The fracture results are particularly interesting, because the great statistical power afforded by the large sample size in this analysis still does not differentiate between the pits within each group. These findings replicate earlier analyses (Binder and VanValkenburgh, 2010; Binder et al., 2002) for pits 61/67 and 13, and extend them to the two more ancient pits (2051 and 91).
Landmark Data
 Procrustes distances between pit means and results of the nonparametric tests for differences in mean shape tests are reported in Table 6. This test was a global non-parametric permutation test using Procrustes distance as a metric (1000 replicates), and identifies highly significant global shape differences among all pits. Table 7 reports the analysis of the variation of global Procrustes distance, and shows the proportion of Procrustes distance attributable to pit membership and centroid size. Visualization of the mean differences for each landmark among pits, and the transitions between them, are depicted in supplementary Animations 1, 2, 3. The results of the landmark position permutation test are highly statistically significant. This demonstrates that there is recognizable shape difference among the wolves from different pits.
Size. The distributions of centroid size are plotted in Figure 4, and the pairwise significance tests are reported in Table 5. Wolves from pit 13 are small compared to those of other pits; this difference is statistically significant with respect to pits 91 and 2051, and marginally so for pit 61/67. Pit 91 mean size may also be larger than that of 61/67; this difference is more subtle and not statistically significant given present sample sizes. However, we may reject the hypothesis that there is no size change among pits at La Brea. The wolves in pit 91 have the largest mean skull size, but this difference is only significant for pit 13 and marginally for pit 61/67. However, the wolves in pit 13 are significantly smaller than all others, and there is robust statistical support for this.
 Multivariate Shape. An eigenanalysis of the covariance matrix of Procrustes shape coordinates was performed and is reported in Table 8. The interpretation of shape change requires the interpretation of the resulting principal components. We attempt interpretation of the first four components, because these are the four carrying the most variance, and are also the only components accounting for more than 5% of the variance in the data set. The eigenvalues from this analysis show that roughly 42% of the shape variance is carried by the first five eigenvalues (13%, 10.6%, 7.2%, 6.1%, 4.5%), and 90% of the shape variance is accounted for by the first 29 components. A global MANOVA for segregation among pits on the first five principal components was highly significant, with p < 0.0001. Individual ANOVAs by pit for PCs 1-5 are reported in Table 8. Segregation among pits is driven primarily by PCs 2 and 4, with PC 3 being a weak discriminator and PC 1 not discriminating at all. The principal components analysis is therefore in broad agreement with the intralandmark analyses described above, demonstrating significant shape differences among pits. Two of the PC axes are also significantly correlated with size (PCs 1 and 4; Table 8), and therefore represent aspects of allometric shape.
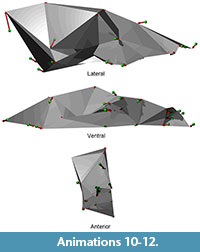
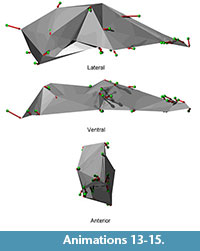
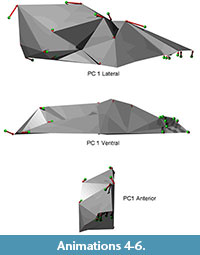 Shape differences on each principal component are visualized as vectors of landmark displacement on the global mean landmark configuration corresponding to a change along each axis by 0.15 units in a positive or negative direction, as noted. An example of a global mean skull with these vectors (from PC 1) is shown in Figure 5, along with a simplified polygonal solid derived from the landmarks. The polygonal solids are equivalent to classical wireframes with opaque panes. Plots of the scores for the first four PCs, along with pit means and 95% confidence intervals, may be found in Figure 6 and Figure 7. Both of these figures show polygonal solids with the respective landmark transition vectors to show translation along each principal component. Additionally, supplemental animations are provided of polygonal solids that depict the landmark deformations along each PC (Animations 4, 5, 6, Animations 7, 8, 9, Animations 10, 11, 12, and Animations 13, 14, 15).
Principal component one exhibits several patterns of shape change (Figure 6). First, the molars are relatively large for animals scoring high on this axis. Second, there is significant reorientation of the skull; the inion and bregma move superiorly and anteriorly relative to the rest of the skull. This alters the lines of action for the temporalis and masseter muscles, making the masseter more vertical and giving it a more advantageous line of action over the larger molars. Lastly, there is clear evidence of static allometry on this axis, with the basicranium relatively large and the viscerocranium relatively small in animals with large molars. Taken together, this axis shows a clear pattern of sexual dimorphism, because it carries the hallmark dimorphism in molar size identified in Canis lupus (O'Keefe et al., 2013). The other shape changes seen on this axis are also plausibly attributable to dimorphism, because they resemble the static allometry observed in C. lupus. This axis is also correlated with size, such that large wolves have small molars while small wolves have large molars, following the expected dimorphic pattern. Lastly, the sexual dimorphism axis does not segregate among pits, indicating it is relatively constant across time.
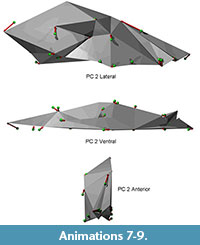 In contrast, principal component two is an excellent segregator among pits, and therefore embodies the principal axis of shape change among pits. This axis relates to skull robusticity (Figure 7). The inion moves posteriorly and down while the bregma moves superiorly; both of these motions indicate an increase in the size of the sagittal crest, the hypertrophy of which is well known in relatively large gray wolves (Goldman, 1944). Additionally, the size of the front of the mouth is correlated with the increase in sagittal crest size, with large incisors and particularly large canines in large animals. Large animals also have a relatively small brain size relative to the viscerocranium, a clear signal of static allometry (O'Keefe et al., 2009).
This axis differentiates pit 91 from the others, although pit 2051 is the most different. Inspection of the plotted landmarks shows that all teeth in pit 91 animals, not just those at the front of the mouth, are relatively large compared to all others. This axis indicates that wolves in pit 91 are notably robust compared to those from other pits, which is logical given their large body size. This axis is not correlated with size, which at face value is counterintuitive, given that static allometry and overall robusticity should be size related. However, the wolves in pit 91, while large, are not significantly so except in the case of pit 13, and marginally for pit 61/67. Pit 91 wolves appear to be more robust than their raw size would indicate, particularly with regard to the dentition. This overall robusticity in pit 91 animals is also visible in the pit-to-pit transition animations.
 Principal component three is also a robusticity axis, but contains other shape change that is not attributable to static allometery (Figure 7). The inion moves superiorly, indicating reduction in the sagittal crest. The bregma is relatively posterior and indicates an increase in size of the basicranium. There is also a marked decrease in the size of the viscerocranium, as is expected in a skull becoming more gracile along the static allometry axis. However, the palate is becoming shorter, as indicated by the reduction in distance between the anterior and posterior dentition. The nasal cavity is also reducing significantly in volume. While some of this shape change may be due to static allometry, much of it seems to be non-allometric shape change between pits 91 and 2051. These two pits are the only two with significant segregation on this axis.
Principal component four is of interest because it statistically separates pit 61/67 wolves from all others (Figure 6). Shape change on this axis represents the ways that 61/67 wolves differ from the others. This axis is also correlated with size, logical given that 61/67 individuals are modestly smaller than those in 2051 and 91. Pit 61/67 wolves are notably gracile, with a small sagittal crest and smaller, more globular basicranium. The viscerocranium is relatively long, with a relatively large external naris. The tooth row is also gracile, with a significantly smaller canine than wolves from other pits, and a longer premolar row. This shape change is not easily accounted for by static allometry, particularly given the lengthening of the snout with overall smaller body size.
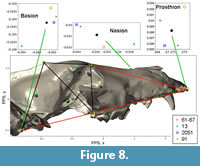
 Interlandmark Distances. Of the seven interlandmark distances in the midline skull lattice (Figure 8), three were found to differ significantly among pits (Table 9; prosthion-nasion, prosthion-staphylion, and staphylion-basion). The first two of these measures segregates pit 13 from all others. These measures contrast the length of the snout vs. the basicranium, and clearly indicate a relatively short snout in pit 13 wolves compared to all others. The third significant distance is the length of the basicranium, from staphyion to basion. This measure pairs pits 13 and 91 against 61/67 and 2051. The basicranium is relatively long in pit 13 and 91 wolves relative to those from pits 61/67 and 2051 (Figure 8). However, the landmark positions associated with these lengths differ in pits 13 and 91. The basion in pit 13 wolves is displaced posteriorly and ventrally relative to all others, while the staphylion is relatively anterior in pit 91. Pit 13 wolves show a large basicranium and a short snout, a signal that is readily interpretable as neoteny along the static allometry axis. This pattern is clear on the plots of the positions of the raw landmarks, but is not a strong signal in the multivariate analysis.
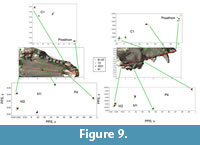
The landmarks and distances of the tooth row appear in Figure 9. There is a clear signal concerning the anterior maxilla and premaxilla among pits (Table 9, Figure 9). The anterior edge of the canine is anteriorly and laterally displaced in pit 91 wolves; this implies that the canine was greater in circumference in pit 91 wolves. The posterior edge of the canine in 61/67 is relatively anterior, demonstrating that the canine in these wolves is relatively small. The interlandmark distances demonstrate that this difference is driven by medial displacement of the posterior edge of the canine, which may indicate a narrowing of the snout in this region. In summary, the canine is large in pit 91 and small in pit 61/67. Pits 13 and 2051 tend to sort together and are intermediate between these extremes.
The interlandmark distance between the posterior edge of the canine and the anterior edge of the carnassial is relatively long in pit 61/67 wolves, and inspection of the landmark positions reveals that this lengthening is due to the small size of the canine and posterior location of the carnassial, but not carnassial size reduction (Figure 9). Inspection of the molar-related landmarks, and interlandmark distances, shows that the molar table is relatively gracile in pit 61/67 wolves and very robust in pit 91 wolves. The gracility of the pit 61/67 wolves is due mainly to shortening of the M1-M2 complex in the anterior-posterior direction, while the robusticity of pit 91 arises from a general increase of relative size at molar landmarks. Again, pits 13 and 2051 tend to sort together, and are intermediate in shape.
In summary, pit 13 wolves clearly show a shorter snout relative to all others. Pit 61/67 wolves have relatively small canines, the anterior snout is narrow but relatively long, and the molars are more gracile. In pit 91 wolves, the posterior portion of the palate is relatively wide, the canine is relatively large, and the molars are significantly larger. A more subtle but significant finding is that pits 13 and 2051 are generally intermediate in terms of dental morphology, and tend to sort together.
DISCUSSION
Time Invariance
We document significant size and shape variation among collections of dire wolf crania from different tar pits at Rancho La Brea. Tooth fracture and wear is also variable among pits. Given that these populations represent the same species from the same location, evolutionary change (in the strict sense, defined as change over time) has therefore been documented with confidence. Wolves from pit 91 are largest in size and have a more robust dentition than wolves from other pits. Wolves from pit 61/67 are medium to small in size and have a relatively gracile dentition. Wolves from pits 13 and 2051 are average in terms of dentition; however, wolves from pit 13 are relatively small, their basicrania are relatively long, and their snouts are relatively short. The presence of interpretable temporal variation among different pits also implies that the geological time of pit deposition is, on average, shorter than the rate of change in these biological factors. However, while we have demonstrated change among the pits at La Brea, a range of factors may be responsible for these changes. These factors might include adaptive change at the genetic level, epigenetic change in response to environmental forces, or simply genetic drift. Below we attempt to infer some of the factors driving change in skull shape over time.
Sexual Dimorphism
Sexual dimorphism is a readily identifiable feature of the dire wolf covariance structure. Shape change due to static allometry comprises the first principal component of the ordination. As described in the results, the increase in molar size, movement down the static allometry axis, and reorientation of the masseter line of action characterize the female morphotype, just as in the gray wolf (O'Keefe et al., 2013). The presence of a prominent axis of sexual dimorphism in these data is reassuring, because it indicates that we are measuring biologically meaningful signal from the skulls. Another important feature of this axis is that it does not segregate among pits. This indicates that the sex ratios in the pits are probably sub-equal, and that dimorphism appears constant over time.
Size and Bergmann's Rule
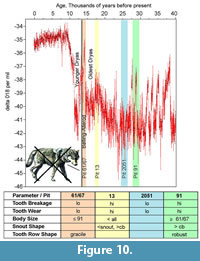 In the Introduction we hypothesized that dire wolf body size should increase with a decrease in temperature. However, this prediction is not borne out by the data. Body size does vary at La Brea, but the smallest wolves occur at a cold period of time (Figure 10). The largest wolves are the oldest, not the youngest and hence warmest (61/67). There is a modest decrease in body size in these youngest wolves. However, because several factors can contribute to body size variation, we must attempt to differentiate nutrient-stress induced neoteny from evolutionary body size changes. There is no guarantee that the body size observed in a given pit sample is truly representative of the body size of the population over evolutionary time scales; it will be a mixture of this plus any epigenetic size impact of nutrient stress occurring over ontogenetic time scales.
Wolves subjected to severe nutrient stress over a significant part of their ontogeny should show a relatively short snout: a relatively short snout reflects neoteny via a truncation of positive ontogenetic allometry of the snout relative to the neurocranium. However, this is true largely of early ontogeny - modern wolves reach dental maturity at 6-7 months but do not reach somatic maturity until an age of about two years (Jones, 1990; Emerson and Bramble, 1993; Kreeger, 2003). Because the criterion for judging adulthood is eruption of the adult dentition, retardation of this late-stage growth should detectable as well, but would be approximately isometric. Therefore, we predict two effects in a population experiencing severe nutrient stress: shape neoteny on the static allometry axis, and size neoteny in the late-stage somatic growth (see Klingenberg, 2010). Wolves in this condition should display heavy tooth wear and fracture, small body size, and crania with relatively short snouts and large neurocrania. However, the teeth should show little or no shape change.This complex of traits is present in pit 13, yielding a concordant picture of nutrient stress impacting this population. We hypothesize that the small centroid size seen in pit 13 is a consequence of the nutrient stress operating on ontogenetic time scales. Furthermore, this sample may be smaller than the mean size of the LGM population at times of low nutrient stress. An increase in nutrition would lead to an increase in size, and this would bring the mean body size in pit 13 into broad agreement with the other pits.
Given the observed impact of nutrient stress on pit 13 wolves, pit 91 wolves should also show some impact of nutrient stress. However, in terms of raw size, pit 91 wolves are the largest of any sampled. In the analysis of shape, pit 91 wolves also differ the most in shape from the others, being significantly more robust. Lastly, and importantly, overall tooth size in pit 91 wolves is relatively large. We interpret this as indicating that there may be an epigenetic neotenic effect indicated by heightened breakage and wear, but that it primarily affects late-stage, somatic growth. Pit 91 wolves show limited movement down the static allometry axis in the form of a relatively large basicranium, but the late-state growth neoteny in the form of relatively large tooth size, is more obvious. Therefore, in pit 91, we hypothesize that nutrient stress was either less severe than in pit 13, or was as severe, but did not begin until the adult wolves in the population had reached dental maturity. Additionally, we hypothesize that body size in pit 91 may be smaller than in an unstressed population. Given that body size in pit 91 is already the largest of all pits, further increase would lead to a population significantly larger than any sampled here. This hypothesis is intriguing but difficult to test, although one potential test could analyze wolves from older deposits, such as pit 77.
If the neotenic effects hypothesized above are valid, body size would decrease with time, with the largest and most robust wolves coming from the oldest pit sampled (91). Therefore the body size trend from pit 91 to pit 13 does not agree with the prediction of a temporal Bergmann's Rule, i.e., that wolves would get larger with decreasing temperature. In fact the opposite occurs. However, the decrease in body size in the significantly warmer pit 61/67 may be an evolutionary signal, because the fracture and wear and associated shape changes do not indicate neoteny due to nutrient stress. Instead pit 61/67 wolves have a more gracile morphology; the canine and molars are small, the snout is narrow, and the premolar row is long. As a complex, these changes are readily interpretable with a change to a warmer climate.
Implications for Fracture and Wear
This study demonstrates for the first time that the LGM, represented by the wolves from pit 13, is not the only interval of nutrient stress encountered by La Brea dire wolves. There is also an interval of nutrient stress circa 28 kya, during the deposition of pit 91. Both breakage and wear events have detectable impacts on the morphology of the wolves involved. These impacts are more severe in pit 13, and the neoteny seen there indicates the stress may have been a multi-year event, with impacts on an ontogenetic time scale. The pit 91 episode may have been less severe, but still has identifiable effects. This decrease in severity may be due to either less extreme stress over a longer period or the onset of severe stress over a shorter period in pit 91 compared to pit 13.
The shape data do not show a coherent shape signal associated with wolves under stress. We therefore conclude that nutrient stress is a rapid-onset occurrence in the wolves sampled and operates over evolutionarily short time periods, on decadal or centennial scales. It clearly drives shape changes on ontogenetic time scales, primarily in late stage growth in pit 91, and into early stage growth as well in pit 13. In pit 91, there is significant shape change between the sample and all other pits. This may be attributable to an evolutionary response to high nutrient stress, particularly if the stress led to increased interspecific competition (Dayan, 1992; Dayan and Simberloff, 1998.) The pit 91 stress event therefore may have been sustained enough to drive evolutionary change, but the driving factor may have been increased resource competition from other carnivores, rather than adaption to increased carcass utilization.
Climate Change Impacts and Unanswered Questions
In a larger taxonomic context, tooth fracture and wear was analyzed among taxa by Meloro (2012). He found carnivores in the Pleistocene were behaving differently than those in the Recent, and that this was not a taxon specific effect: carnivores as a guild appear to have behaved differently in the Pleistocene than they do today. These behavioral differences are reflected in elevated fracture and wear values for Pleistocene taxa. Meloro suggests several causal factors that might explain this different behavior, including larger prey size and the consumption of frozen carcasses.
However, this study shows that tooth fracture and wear is variable throughout the Pleistocene, being high in some intervals and lower in others. Also, fracture and wear events appear to have rapid onset and occur over short time scales. This argues against a systematic, Pleistocene-wide factor or factors causing elevated fracture and wear as suggested by Meloro, because the factor or factors causing the underlying nutrient stress are not always operating. They can be seen to be operating in pits 91 and 13, but not in pits 2051 and 61/67, in both the fracture and wear data itself and the epigenetic ontogenetic impacts the nutrient stress has on affected populations.
Can a factor be identified that functions over decadal time scales in the Pleistocene, but not the Holocene, that might cause ephemeral instances of nutrient stress? Inspection of the North American climate record from the GRIP and NGRIP climate records (NGRIP, 2004) reveals that the climate in both glacial and interglacial periods contains cyclicity with a period of about 1500 years. In the interglacial Holocene, these hot and cold cycles are called Bond intervals, and temperature change is relatively small, on the order of a few degrees. In glacial periods these cycles are much more severe, with changes in temperature an order of magnitude larger. Furthermore, these climatic transitions have extremely rapid onsets of warming followed by gradual cooling, with the periods of rapid warmings termed Dansgaard-Oeschger events (D-O events, Rahmstorf, 2003). During D-O events, temperature rises from deep glacial cold to almost interglacial levels (on the order of 10o C) in a matter of decades. Such rapid warming would cause a great increase in both temperature and aridity at La Brea, with attendant ecological upheaval. This suggests a possible causal link between D-O events and fractures and wear occurrences. This link might be tested by searching for correlation between D-O events and the times of deposition of pits showing increased breakage and wear.
However testing for this correlation is not yet possible. Current constraints on the dating of La Brea tar pit deposits is too imprecise to allow exact chronological comparisons with the climatic record, which is known with great precision from ice core data. Nevertheless pit 91 is the most well dated pit, and was deposited about 28 kya, possibly coeval with the large D-O events 3 or 4. The approximate age of deposition of pit 2051 is 26 kya, a relatively quiescent period without major D-O events, and nutrient stress in this pit is low. Pit 13 has very high nutrient stress at 18 kya. While this is not correlated with a D-O event, the age of pit 13 is based on only six radiocarbon dates, and hence it is impossible to say definitively if this nutrient stress has a climatic correlation. Lastly, pit 61/67 was deposited during the Bølling-Allerod warm interval and has no sign of nutrient stress but does seem to reflect adaptation to warm climatic conditions. There are significant D-O events at the end of the Pleistocene associated with the initial warming to the Bølling-Allerod interval and with the end of the Younger Dryas, but the dating of pits 13 and 61/67 is currently too imprecise to demonstrate whether their deposition is associated with these events.
In summary, fracture and wear events at La Brea appear episodic and of short duration, and have obvious ontogenetic impacts and possible evolutionary impacts when they do occur. Constant, whole-system forcing factors like those suggested by Meloro (2012) are therefore unlikely. The greatly increased climate volatility characteristic of the terminal Pleistocene, on the other hand, is both intermittent and operates over the correct time scales to cause the observed episodes of elevated breakage and wear. The limited dating information so far available for the La Brea pit deposits shows intriguing correlations with episodes of rapid warming for pit 91 but not for pit 13. However, current constraint on La Brea deposition ages is too imprecise to allow more concrete conclusions. More and better dates of the different pits at La Brea, particularly pits 13 and 61/67, are required, coupled with explicit modeling of the taphonomic parameters underlying each pit age distribution.
ACKNOWLEDGMENTS
FRO gratefully acknowledges the support of NYCOM research funds and funding from the Marshall Foundation. This research was funded by a NSF RII grant to Marshall University, and a WV NASA Space Consortium grant to FRO. P. Holroyd, J. Harris, C. Shaw, A. Farrell, and G. Takeuchi provided gracious assis- tance at the UCMP and the Page, respectively, while J. Meachen provided timely assistance. This paper is dedicated to Farish Jenkins.
REFERENCES
Ashton, K.G., Tracy, M.C., and de Queiroz, A. 2000. Is Bergmann's rule valid for mammals? The American Naturalist, 156:390-415.
Binder, W.J. and Van Valkenburgh, B. 2010. A comparison of tooth wear and fracture in Rancho La Brea sabertooth cats and dire wolves across time. Journal of Vertebrate Paleotology, 30:255-261.
Binder, W.J., Thompson, E.N., and Van Valkenburgh, B. 2002. Temporal variation in tooth fracture among Rancho La Brea dire wolves. Journal of Vertebrate Paleontology, 22:423-428.
Bookstein, F.L. 1991. Morphometric Tools for Landmark Data. Geometry and Biology. Columbia University Press, Cambridge, UK.
Coltrain, J.B., Harris, J.M., Cerling, T.E., Ehleringer, J.R., Dearing, M.-D., Ward, J., and Allen, J. 2004. Rancho La Brea stable isotope biogeochemistry and its implications for the paleoecology of late Pleistocene, coastal southern California. Palaeogeography, Palaeoclimatology, Palaeoecology, 205:199-219.
Dayan, T. 1992. Canine carnassials: community-wide character displacement among the wolves, jackals, and foxes of Israel. Biological Journal of the Linnean Society, 45:315-331.
Dayan, T. and Simberloff, D. 1998. Size patterns among competitors: ecological character displacement and character release in mammals, with special reference to island populations. Mammal Review, 28:99-124.
Emerson, S.B. and Bramble, D.M. 1993. Scaling, allometry, and skull design, pp. 384-421. In Hanken, J. and Hall, B.K. (eds.), The Skull: Functional and Evolutionary Mechanisms (3). University of Chicago Press, Chicago.
Fox-Dobbs, K., Bump, J.K., Peterson, R.O., Fox, D.L., and Koch, P.L. 2007. Carnivore-specific stable isotope variables and variation in the foraging ecology of modern and ancient wolf populations: case studies from Isle Royale, Minnesota, and La Brea. Canadian Journal of Zoology, 85:458-471
Fox-Dobbs, K., Stidham, T.A., Bowen, G.J., Emslie, S.D., and Koch, P.L. 2006. Dietary controls on extinction versus survival among avian megafauna in the late Pleistocene. Geology, 34:685-68.
Friscia, A.R., Van Valkenburgh, B., Spencer, L., and Harris, J. 2008. Chronology and spatial distribution of large mammal bones in Pit 91, Rancho La Brea. Palaios, 23:35-42.
Frost, S.R., Marcus, L.F., Bookstein, F.L., Reddy, D.P., and Delson, E. 2003. Cranial allometry, phylogeography, and systematics of large-bodied papionins (Primates: Cercopithecinae) inferred from geometric morphometric analysis of landmark data. The Anatomical Record Part A: Discoveries in Molecular, Cellular, and Evolutionary Biology, 275:1048-1072.
Gardner, J.L., Peters, A., Kearney, M.R., Joseph, L., and Heinsohn, R. 2011. Declining body size: a third universal response to warming? Trends in Ecology & Evolution, 26:285-291.
Giest, V. 1987. Bergmann's rule is invalid. Canadian Journal of Zoology, 65:1035-1038.
Gill, J.L., Williams, J.W., Jackson, S.T., Lininger, K.B., and Robinson, G. S. 2009. Pleistocene megafaunal collapse, novel plant communities, and enhanced fire regimes in North America. Science, 326:1100-1103.
Goldman, E.A. 1944. Classification of wolves, pp. 389-636. In Young, S.P. and Goldman, E.A. (eds.), The Wolves of North America, Part 2. Dover Publications, Inc., New York.
Goodrich, E.S. 1930. Studies on the Structure and Development of Vertebrates. Macmillan and Co., London.
Goulet, G.D. 1993. Comparison of temporal and geographical skull variation among Nearctic, modern, Holocene, and late Pleistocene gray wolves (Canis lupus) and selected Canis. Master's thesis, University of Manitoba, Winnipeg. 1-116.
Hawthorne, A.J., Booles, D., Nugent, G.G., and Wilkinson, J. 2004. Body-weight changes during growth in puppies of different breeds. Journal of Nutrition, 134:2027S-2030S.
Heusser, L.E. 1998. Direct correlation of millennial-scale changes in western North America vegetation and climate with changes in the California Current system over the past ?60 kyr. Paleoceanography, 13:252-262.
Heusser, L.E. and Sirocko, F., 1997. Millennial pulsing of environmental change in southern California from the past 24 ky; a record of Indo-Pacific ENSO events? Geology, 25:243-246.
Jones, E. 1990. Physical characteristics and taxonomic status of wild canids, Canis familiaris, from the eastern highlands of Victoria. Australian Wildlife Research 17:69-81.
Jungers, W.L., Falsetti, A.B., and Wall, C.E. 1995. Shape, relative size, and size-adjustment in morphometrics. Yearbook of Physical Anthropology, 38:137-161.
Kennett, D.J., Kennett, J.P., West, G.J., Erlandson, J.M., Johnson, J.R., Hendy, I.L., West, A., Culleton, B.J., Jones, T.L., and Stafford, T.W. 2008. Wildfire and abrupt ecosystem disruption on California's Northern Channel Islands at the Ållerød–Younger Dryas boundary (13.0–12.9 ka). Quaternary Science Reviews, 27:2528–2543.
Klingenberg, C.P. 2010. Evolution and development of shape: integrating quantitative approaches. Nature Reviews Genetics, 11:623-635.
Kreeger, T.J. 2003. The internal wolf: physiology, pathology, and pharmacology, pp. 192-217. In Mech, L.D. and Boitani, L. (eds.), Wolves: Behavior, Ecology, and Conservation. University of Chicago Press, Chicago, IL.
Koch, P.L. and Barnosky, A.D. 2006. Late quaternary extinctions: state of the debate. Annual Review of Ecology, Evolution, and Systematics, 37:215-250
Krzanowski, P.J., McCarthy, W.V., and Thomas, M.R. 1995. Discriminant analysis with singular covariance matrices: methods and applications to spectroscopic data. Journal of the Royal Statistical Society, Series C, 44:101-115.
Lyons, S.K., Smith, F.A., and Brown, J.H. 2004. Of mice, mastadons, and men: human mediated extinction on four continents. Evolutionary Ecology Research, 6:339-58.
Marcus, L.F. 1990. Traditional morphometrics, pp. 77-122. In Rohlf, F.J. and Bookstein, F.L., (eds.), Proceedings of the Michigan Morphometrics Workshop, Special Publication 2. University of Michigan Museum of Zoology, Ann Arbor, Michigan, USA.
Marcus, L.F. and Berger, R. 1984. The significance of radiocarbon dates for Rancho La Brea, pp. 159-188. In Martin, P.S., and Klein, R.G. (eds.), Quaternary Extinctions. University of Arizona Press, Tuscon, AZ.
McNab, B.K. 2010. Geographic and temporal correlations of mammalian size reconsidered: a resource rule. Oecologia, 164:13-23.
Meachen, J.A. and Samuels, J.X. 2012. Evolution in coyotes (Canis latrans) in response to the megafaunal extinctions. Proceedings of the National Academy of Sciences, 109:4191-4196.
Meachen, J.A., O'Keefe, F.R., and Sadleir, R.W. 2014. Evolution in the sabre-tooth cat, Smilodon fatalis, in response to Pleistocene climate change. Journal of Evolutionary Biology, 27:714-723.
Meloro, C. 2012. Mandibular shape correlates of tooth fracture in extant Carnivora: implications to inferring feeding behavior of Pleistocene predators. Biological Journal of the Linnean Society, 106:70-80.
Menard, H.W. 1947. Analysis of measurements in length of the metapodials of Smilodon. Bulletin of the Southern Academy of Sciences, 46:127-135.
Mosimann, J.E. and Malley, J.D. 1979. Size and shape variables, pp. 175-189. In Orioci, L., Rao, C.R., and Stiteler, W.M. (eds.), Multivariate Methods in Ecological Work. International Cooperative Publishing House, Fairland, MD.
NGRIP: North Greenland Ice Core Project Members. 2004. High resolution record of northern hemisphere climate extending into the last interglacial period. Nature, 431:147-151.
Nigra, J.O. and Lance, J.F. 1947. A statistical study of the metapodials of the dire wolf group. Bulletin of the Southern Academy of Sciences, 46:26-34.
Nowak, R.M. 1979. North American Quaternary Canis. Monograph 6, Museum of Natural History, University of Kansas, Lawrence, Kansas, 1-154.
Nowak, R.M. 2003. Wolf taxonomy and evolution, pp. 239-258. In Mech, L.D. and Boitani, L. (eds.), Wolves: Behavior, Ecology, and Conservation. University of Chicago Press, Chicago, IL.
O'Keefe, F.R., Fet, E.V., and Harris, J.M. 2009. Compilation, calibration, and synthesis of faunal and floral radiocarbon dates, Rancho La Brea, California. Contributions in Science, Los Angeles County Museum of Natural History, 518:1-16.
O'Keefe, F.R., Meachen, J.A., Fet, E.V., and Brannick, A.L. 2013. Ecological determinants of morphological variation in the cranium of the North American gray wolf. Journal of Mammalogy, 94:1223-1236.
O'Higgins, P. and Jones, N. 1990. Facial growth in Cercocebus torquatus: An application of three dimensional geometric morphometric techniques to the study of morphological variation. Journal of Anatomy, 193:251-272
O'Higgins, P. and Jones, N. 2006. Tools for statistical shape analysis. Hull York Medical School. http://sites.google.com/site/hymsfme/resources.
Petit, J.R., Jouzel, J., Raynaud, D., Barkov, N.I., Barnola, J.M., Basile, I., Bender, M., Chappellaz, J., Davis, J., Delaygue, G., Delmotte, M., Kotlyakov, V.M., Legrand, M., Lipenkov, V., Lorius, C., Pépin, L., Ritz, C., Saltzman, E., and Stievenard, M. 1999. Climate and atmospheric history of the past 420,000 years from the Vostok ice core, Antarctica. Nature, 399:429-436.
Prothero, D.R., Syverson, V.J., Raymond, K.R., Madan, M., Molina, S., Fragomeni, A., DeSantis, S., Sutyagina, A., and Gage, G.L. 2012. Size and shape stasis in late Pleistocene mammals and birds from Rancho La Brea during the Last Glacial–Interglacial cycle. Quaternary Science Reviews 56:1-10.
Quinn, J.P. 1992. Rancho La Brea: Geologic setting, Late Quaternary depositional patterns and mode of fossil accumulation, pp. 221-232. In Heath, E.G., and Lewis, W.L. (eds.), The Regressive Pleistocene Shoreline, Southern California. Guidebook No. 20, South Coast Geological Society, Santa Ana, California.
Rahmstorf, S. 2003. Timing of abrupt climate change: a precise clock. Geophysical Research Letters, 30, DOI:10.1029/2003GL017115
Stock, C. and Harris, J.M. 1992. Rancho La Brea: A record of Pleistocene life in California. Science Series No. 37, Natural History Museum of Los Angeles County, Los Angeles, CA.
Tseng, J.Z. and Wang, X. 2010. Cranial functional morphology of fossil dogs and adaptation for durophagy in Borophagus and Epicyon (Carnivora, Mammalia). Journal of Morphology, 271:1386-1398.
Van Valkenburgh, B. 1988. Incidence of tooth fracture among large, predatory mammals. American Naturalist, 13:291-302.
Van Valkenburgh, B. 2009. Costs of carnivory: tooth fracture is Pleistocene and recent carnivores. Biological Journal of the Linnean Society, 96:68-81.
VanValkenburgh, B., and Hertel, F. 1993. Tough times at La Brea: tooth fracture in carnivores of the late Pleistocene. Science 261:456-459.
Van Valkenburgh, B. and Sacco, T. 2002. Sexual dimorphism, social behavior, and intrasexual competition in large Pleistocene carnivorans. Journal of Vertebrate Paleontology, 22:164-169.
Zelditch, M.L., Swiderski, D.L., Sheets, H.D., and Fink, W.L. 2004. Geometric Morphometrics for Biologists. Elsevier Academic Press, San Diego, CA.
