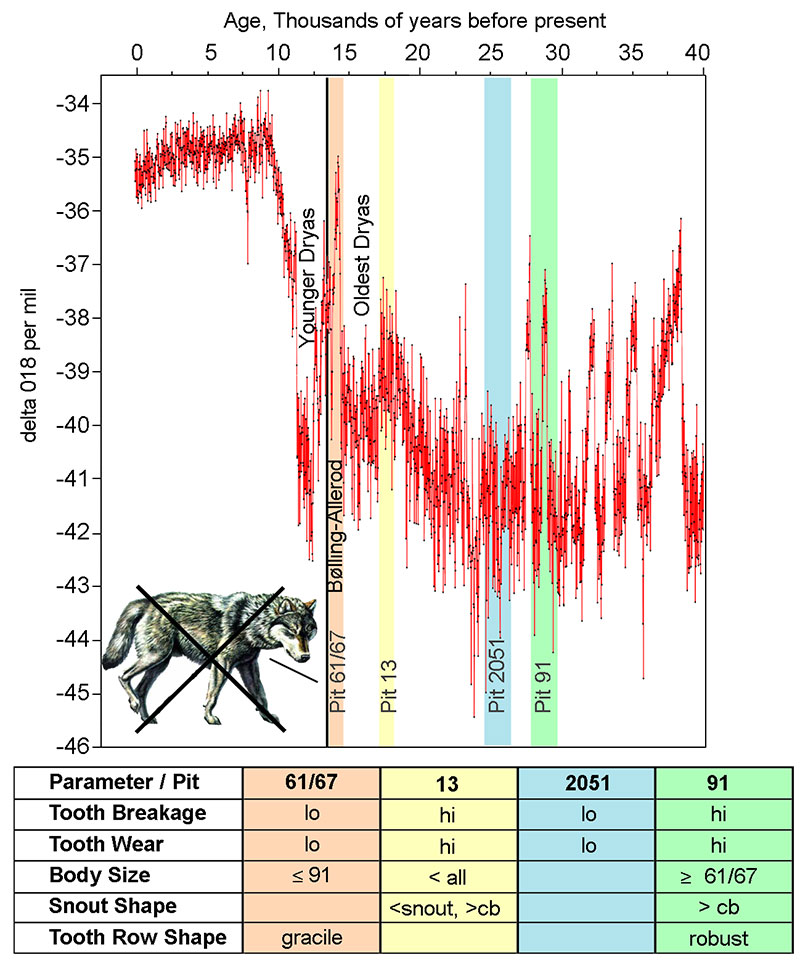
FIGURE 1. Frequency histograms of tooth fracture from La Brea tar pits 61/67, 13, 2051, and 91. Date before present increases from left to right. A score of 0 represents no fracture; a score of 1, broken. Pits 13 and 91 (the high fracture group) show significantly more fracture than pits 61/67 and 2051. For statistics see Table 2 and Table 3.
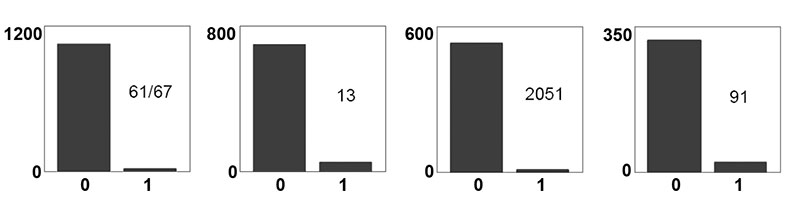
FIGURE 2. Frequency histograms of tooth wear from La Brea pits 91, 2051, 13, and 61/67 (in reverse chronological order). Amount of wear increases from a score of one (no wear) to five (heavy wear). Pits 13 and 91 (the high wear group) show significantly more wear than pits 61/67 and 2051. For statistics see Table 2 and Table 3.
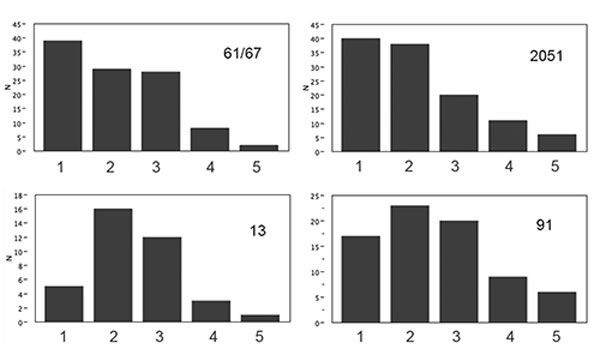
FIGURE 3. Locations of the 27 landmarks used in this study superimposed on a 3D surface model of a dire wolf skull generated from a medical CT scan of a specimen in the Marshall University teaching collection. This skull is from pit 61 and has been at Marshall for decades, and bears the number 2300-493 as well as grid coordinates, all marked identically to skulls in the collection at the Page Museum. For a list of landmarks see Table 4.
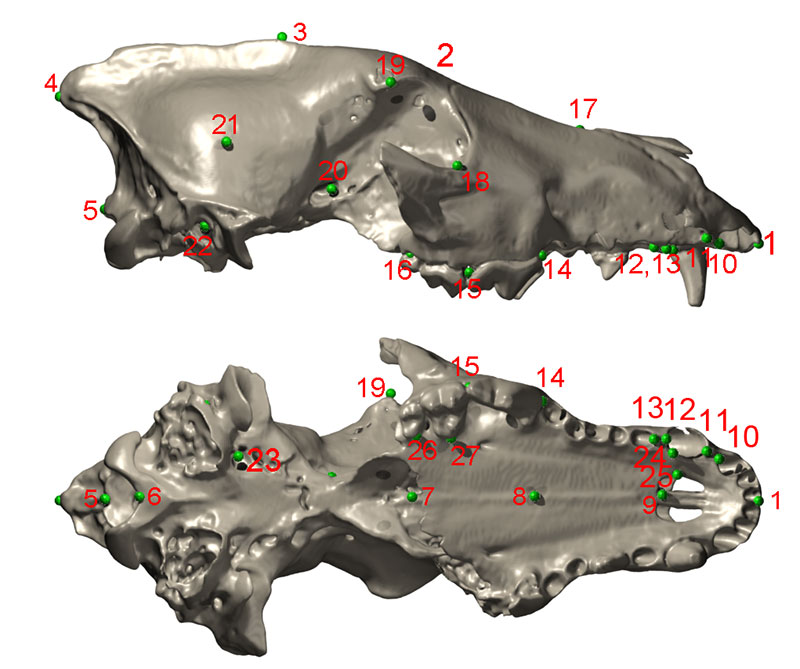
FIGURE 4. Plot of centroid size derived from Procrustes superimposition; n = 73 skulls from four pits of varying ages measured for 27 landmarks. Points are estimates of the mean for each pit, and bars are 95% confidence limits on the mean. Body size is significantly smaller in Pit 13; full statistics are listed in Table 5.
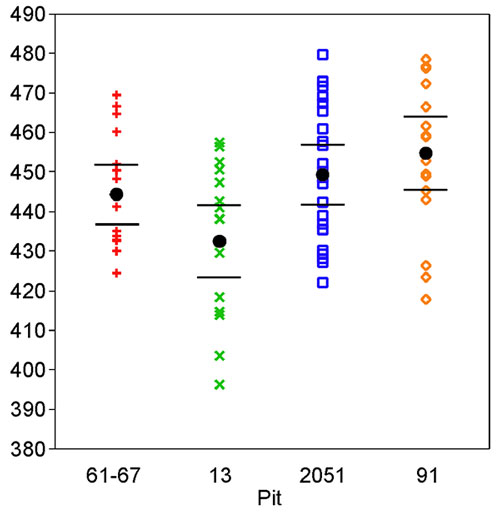
FIGURE 5. Vector translations of each landmark moving along Principal Component 1. Both a skull and a polygon derived from the landmarks are shown. Shape change associated with Principal Component 1 (PC1) is depicted as vectors of landmark displacement corresponding to a change along the PC axis by 0.15 units in the positive direction. Morphological surfaces are interpolations of shape based on landmark movement.
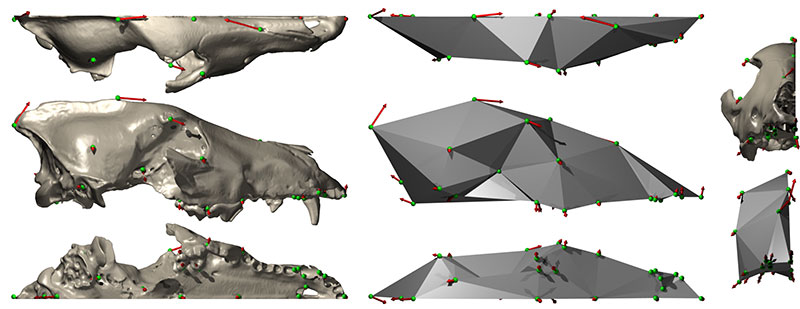
FIGURE 6. Plot of PC 1 vs. PC 4 scores, divided by pit. Error bars on each pit mean score are 95% confidence intervals. Polygons indicate landmark vector translations along the principal component indicated. Principal component 1 and 4 vectors are deviations from the global mean shape (pictured in the upper right corner) in a negative direction. See PC1 Animations and PC4 Animations for deformations; also, the anterior, lateral, and ventral polygons for each PC are linked directly to the corresponding animation. Dorsal polygons are not animated.
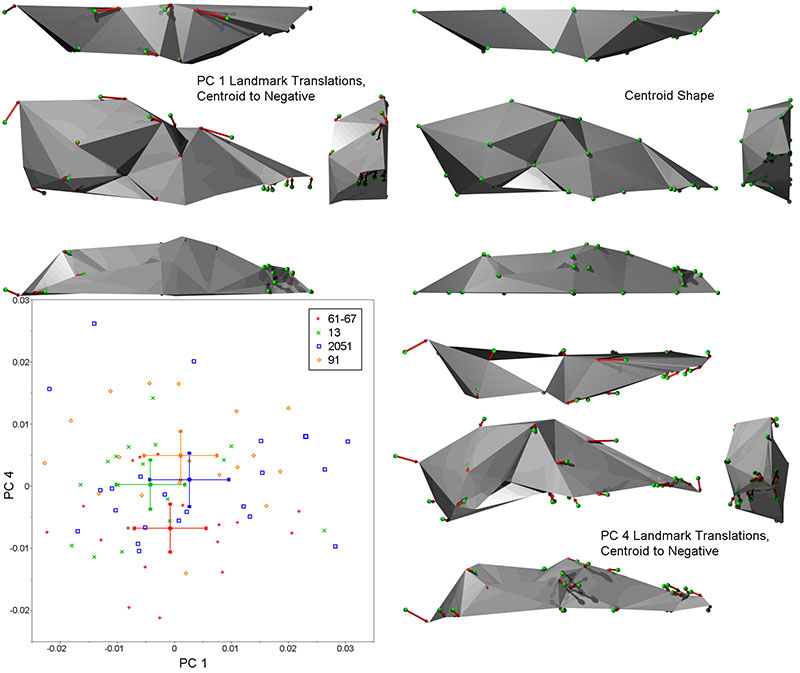
FIGURE 7. Plot of PC 2 vs. PC 3 scores, divided by pit. Error bars on each pit mean score are 95% confidence intervals. Polygons indicate landmark vector translations along the principal component indicated. Principal component 2 vectors are from the centroid in a negative direction, while PC 3 vectors are from the centroid in a positive direction. See PC2 Animations and PC3 Animations for deformations; also, the anterior, lateral, and ventral polygons for each PC are linked directly to the corresponding animation. Dorsal polygons are not animated.
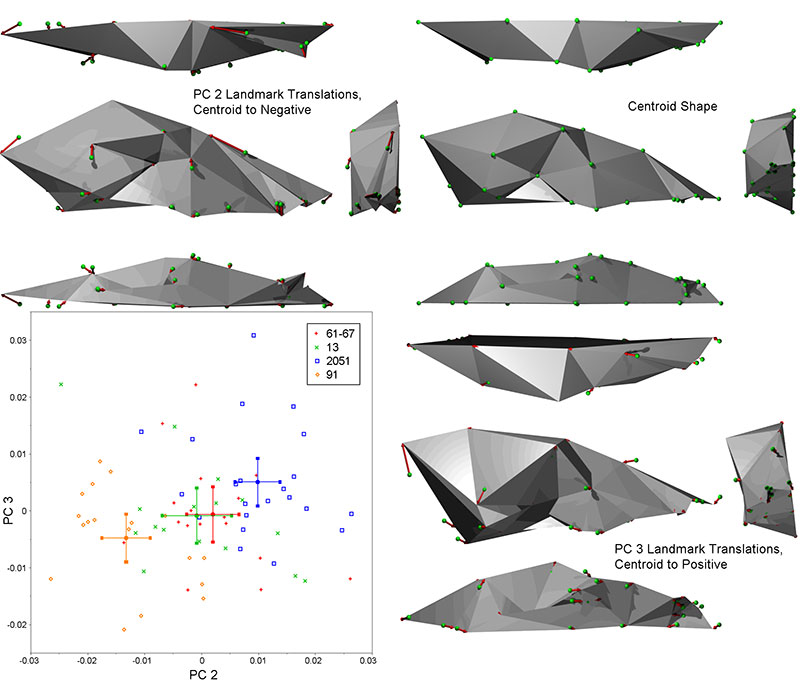
FIGURE 8. Interlandmark distances evaluated for five midline lanmarks; Procrustes x and y shape coordinates are shown. Mean landmark positions for each pit are plotted with the global mean (black dot). Of these, prosthion and basion have highly significant differences among means. Red lines are significantly different as calculated by ANOVA by pit, black lines are not. The position of the prosthion is highly variable, while the prosthion-nasion and prosthion-staphylion distances are shorter in pit 13 wolves versus the others. The length of the cranial base is longer in both pit 13 and pit 91 wolves, however, the basion is displaced posteriorly in pit 13 wolves; while the staphylion is displaced anteriorly in pit 91 wolves. For statistics see Table 9.
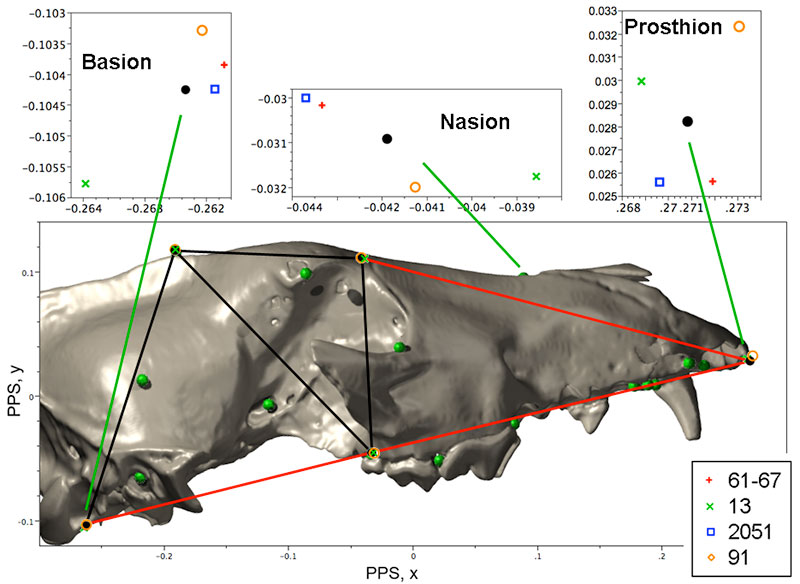
FIGURE 9. Interlandmark distances evaluated for 10 palatal and tooth row landmarks. Coordinates x and z are shown in the left plots, while x and y are shown in the right plots. Red lines indicate significantly different distances as determined by ANOVA by pit; black lines are not significantly different. The location of the prosthion is highly variable, showing variation among all comparisons except 2051-13. The location of the posterior edge of the canine is more anterior in 61/67 wolves versus all others. Examination of the interlandmark distances shows that canine variation has a significant medio-lateral component, which may indicated a wider snout in pit 91 and a more narrow one in pit 61/67; again, pits 13 and 2051 tend to sort together. Significantly different interlandmark distances are shown in red. The postion of the anterior edge of the canine is more lateral in pit 91 wolves vs. all others. For statistics see Table 9.
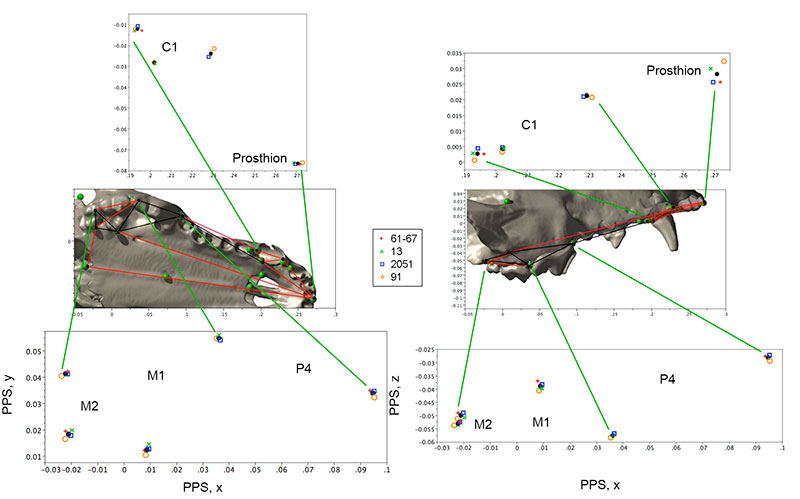
FIGURE 10. Summary of events, temperature, and biotic variation at Rancho La Brea. Climate data from NGRIP (2004).