FIGURE 1. Millipede morphology and distribution. 1. Diagram of Narceus americanus showing the head, first five segments, and three diplosegments. 2. Distribution map of N. americanus after Shelley et al. (2006). Inset map shows the distribution of Floridobolus penneri in central Florida. 3. Coiled N. americanus individual used in this study. 4. Narceus americanus from the Smoky Mountains, Tennessee. 5. A F. penneri individual used in this study. Scale bar equals 1 cm.
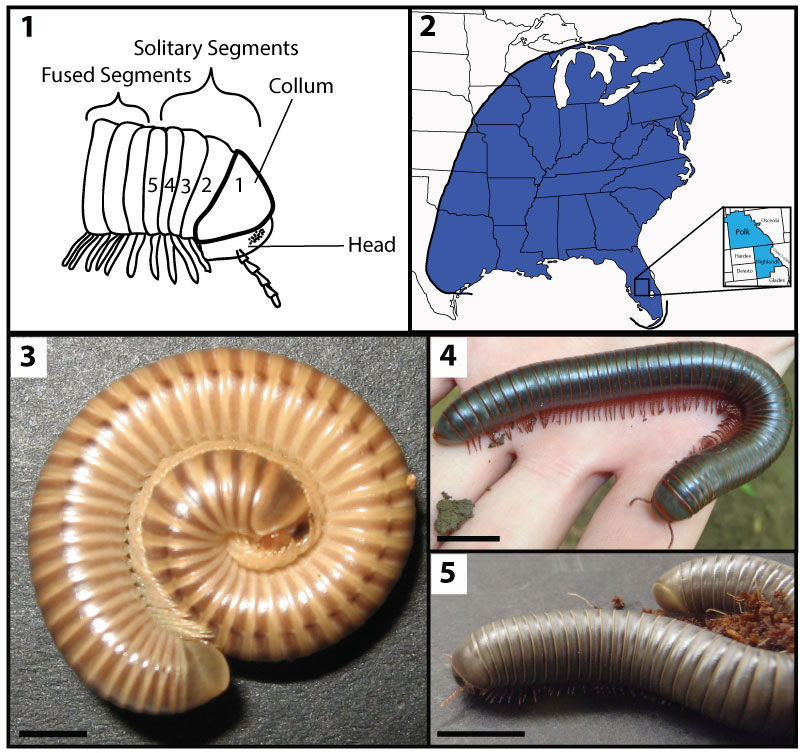
FIGURE 2. Diagrams of quantitative burrow measurements. 1. Burrows were described using the mean of the angle at which they entered the subsurface (a) and the angle at which they shift below the surface (a1), total length (L), branching angle (BA), maximum depth below the surface (D), shaft and chamber width (w), height (h), and circumference (c). 2. The complexity of a burrow system is the sum of the number of entrances (e), segments (s), and chambers (ch). 3. The tortuosity of a burrow system is the mean sinuosity of all burrow segments in the system. A single segment's tortuosity is the total length of the segment (u) divided by the straight line distance (v).
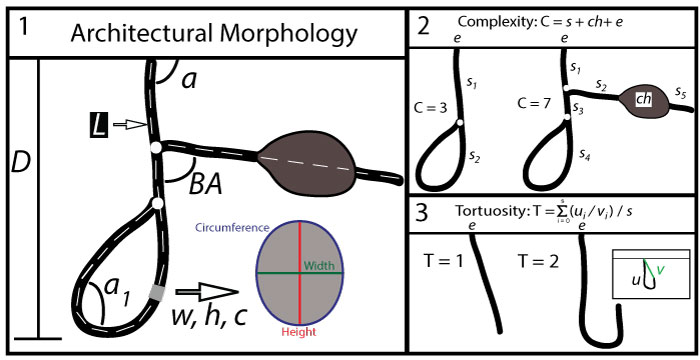
FIGURE 3. Dominant burrow architectures and modifications produced by Narceus americanus and Floridobolus penneri. Percents given include burrows produced by both N. americanus and F. penneri. Complexity (C) and tortuosity (T) are the average values for each burrow type. 1. Dominant architectures produced by the millipedes. 2. Modifications to dominant architectures that affect the quantitative properties. Black portions of the illustration represent the modifying structures while gray portions represent the modified dominant architecture.
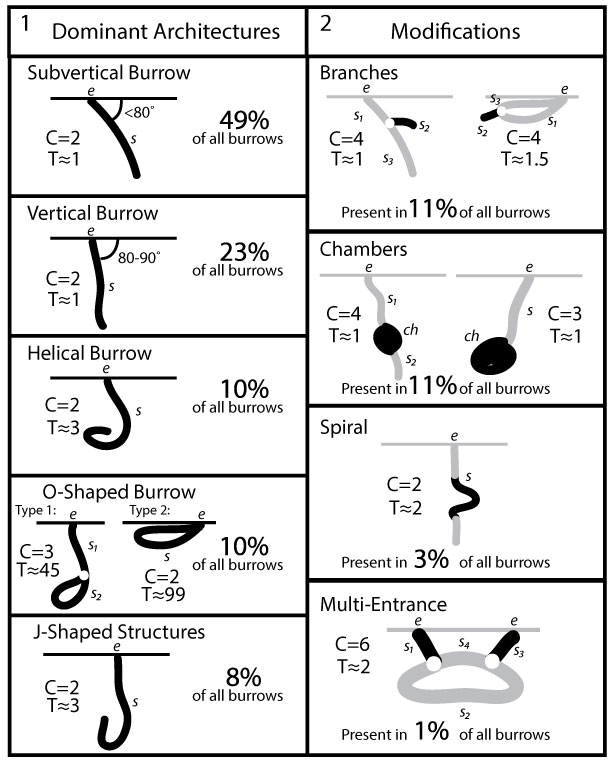
FIGURE 4. Time lapse photographs of Narceus americanus burrowing in 50O/50S sediment with 35% moisture content. The photos are taken at approximately two minute intervals.
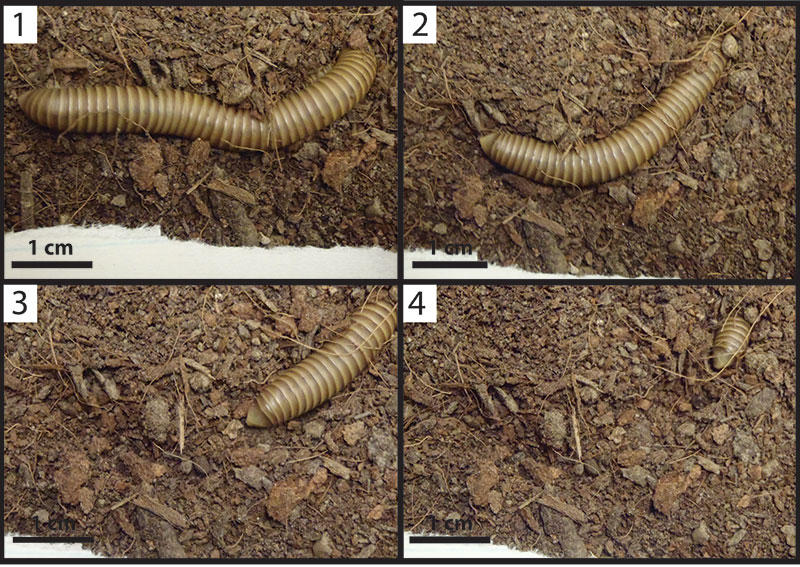
FIGURE 5. Behaviors exhibited by Floridobolus penneri. 1. Experiment with 50O/50S sediment, 49% moisture content with five individuals in a 65 gallon terrarium. Two millipedes are in chambers against the glass. Inset: Large chamber with a coiled millipede; molting was later observed in this chamber. 2. Molting individual at the sediment surface. 3. Millipede excavated from 5 cm below the surface of a 50Sa/50S, 70% moisture content experiment; the white line indicates the sediment surface.
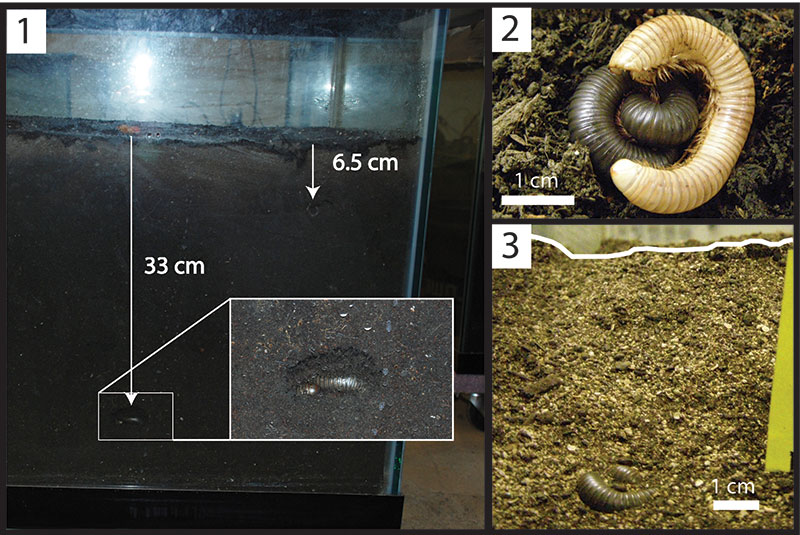
FIGURE 6. Surface traces produced by Narceus americanus and Floridobolus penneri. 1. Surface furrowing and a shallow burrow produced by N. americanus in 50O/50S sediment with 35% moisture content. 2. Surface furrowing (at arrows) produced by F. penneri in 25Sa/75S sediment with 50% moisture content. 3. Trails (at arrows) produced around the edges of a terrarium. 4. Close-up of a trail (at arrows) along the terrarium edge outlined by large grains in 50O/50S sediment. 5. Burrow entrance produced by F. penneri in 50Sa/50S sediment. 6. Burrow entrance produced by N. americanus in 50O/50S sediment.
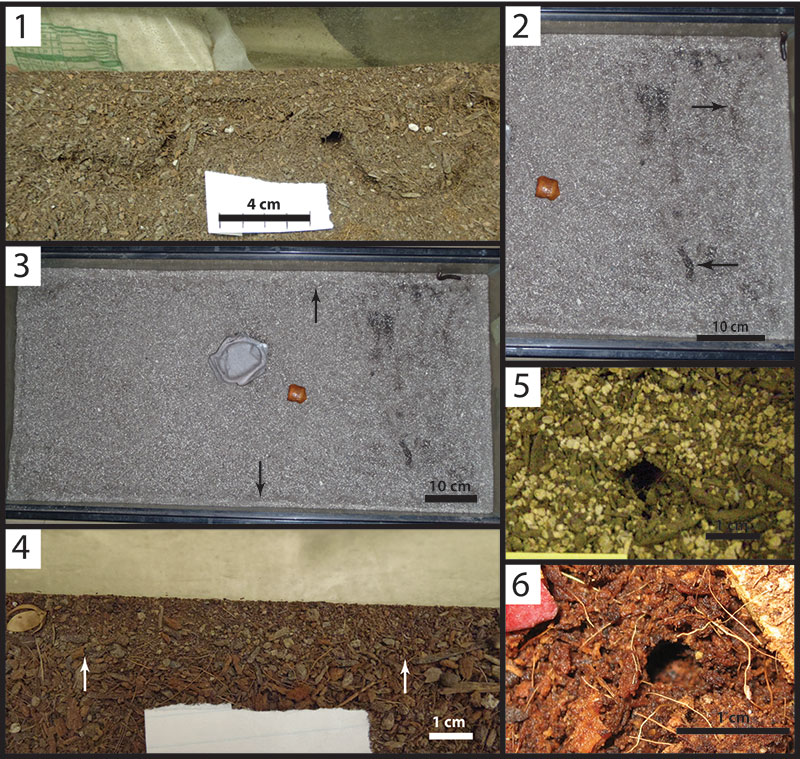
FIGURE 7. Surficial features. 1. Vertically oriented, wedge-shaped indent at the end of NA21F. Photograph taken from below the burrow cast at an oblique angle. 2. Vertically oriented, wedge-shaped indent at the end of NA26A. Photograph taken from below the burrow cast at an oblique angle. 3–5. Fecal pellets in the walls, floors, endpoints, and chambers of three Floridobolus penneri burrows (FP7H, FP7F, FP7G).
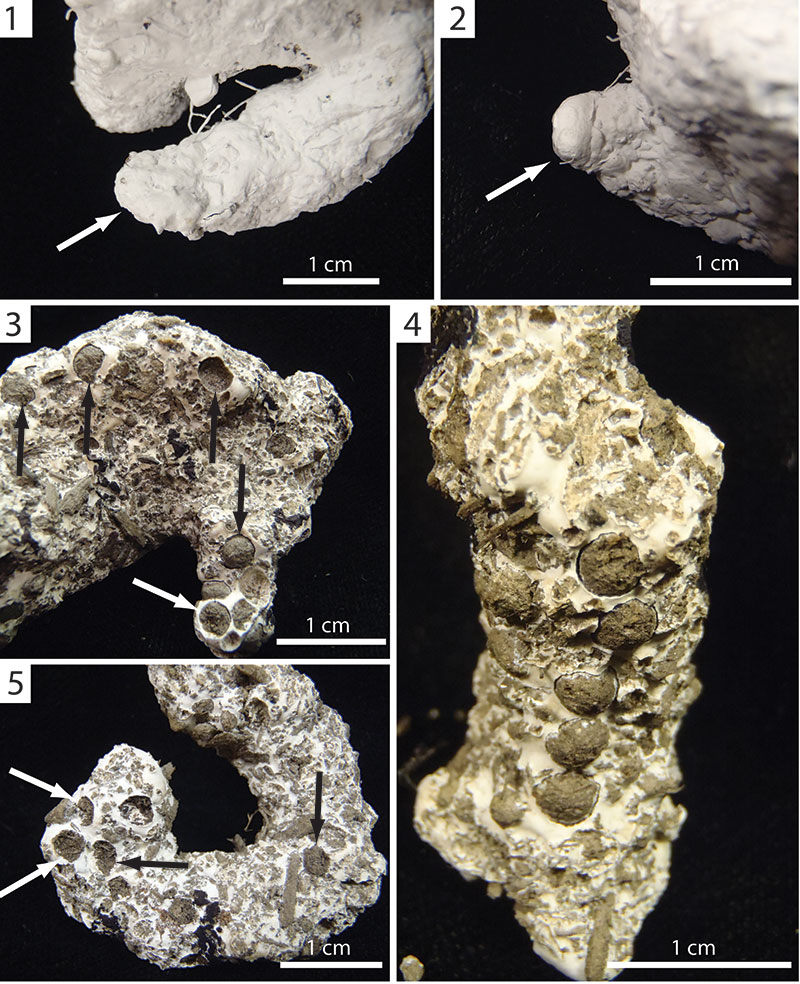
FIGURE 8. Vertical burrows produced by Narceus americanus (1–3) and Floridobolus penneri (4–6). 1, 2. Side views of two simple, vertical burrows (NA30A, NA33A). 3. Oblique view of a vertical burrow with a terminal helical structure (NA30F). 4, 5. Side views of two simple, vertical burrows (FP2A, FP2B). 6. Side view of a vertical burrow with an intermediate helical modification (FP7D).
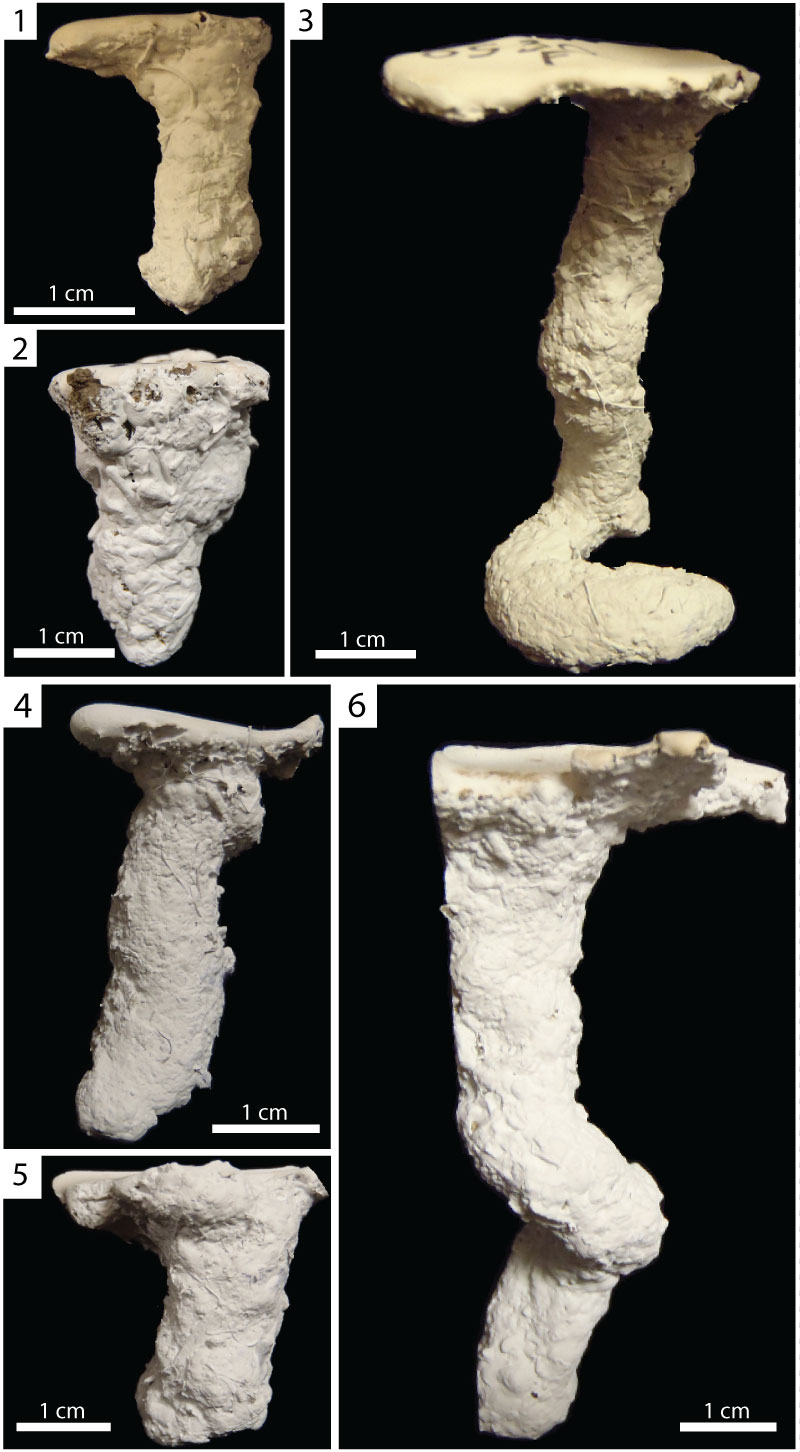
FIGURE 9. Subvertical burrows produced by Narceus americanus. 1. Side view of a simple, subvertical burrow (NA21C). 2. Side view of a simple, subvertical burrow (NA30D). 3. Front view of a subvertical burrow with a small branch near the entrance (NA21D). 4. Front view of a subvertical burrow with a small intermediate chamber (NA21E). 5. Side view of a subvertical burrow with a terminal chamber (NA26A) and a wedge-shaped indent (at arrow).
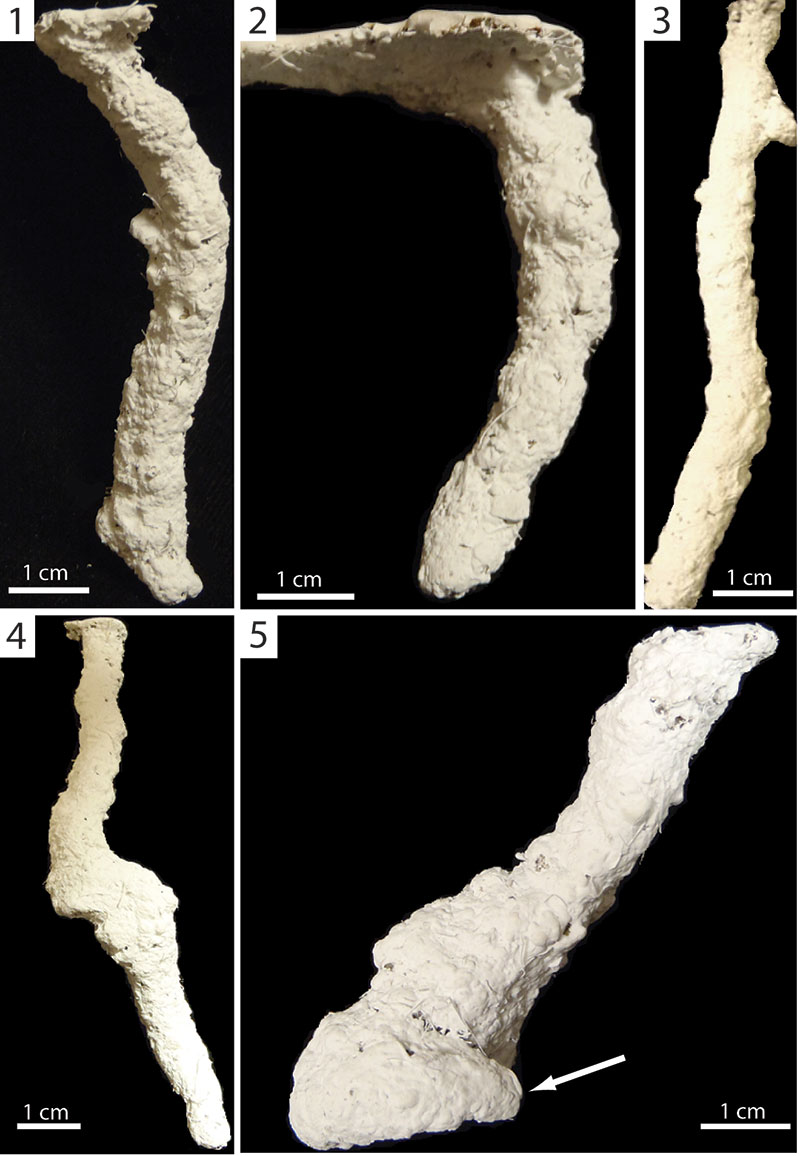
FIGURE 10. Subvertical burrows produced by Floridobolus penneri. 1. Front view of a simple, sinuous, subvertical burrow (FP2F). 2. Side view of a simple, subvertical burrow (FP2E). 3. Side view of a subvertical burrow with a small branch near the entrance (FP7F). 4. Side view of a subvertical burrow with a terminal chamber (FP5E). 5. Side view of a subvertical burrow with a large chamber and small branch (FP7H).
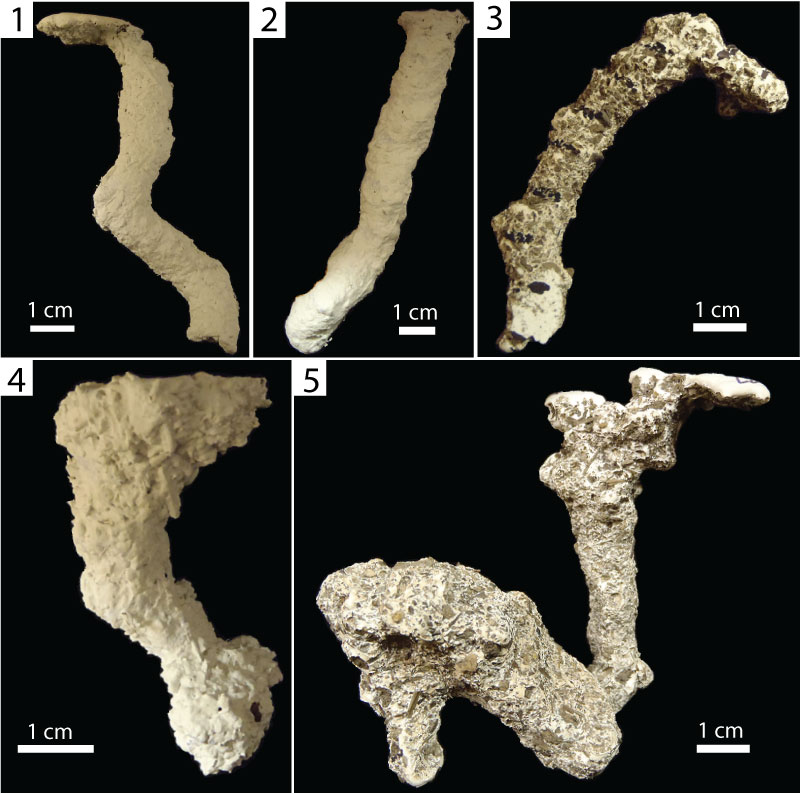
FIGURE 11. Helical burrows produced by Narceus americanus (1–3) and Floridobolus penneri (4–5). 1. Side view of a simple, helical burrow (NA25B). 2. Side view of a helical burrow with a small branch (NA29B). 3. Oblique view of a helical burrow with a chamber in the midsection of the burrow (NA21F) bearing a wedge-shaped indent (at arrow). 4. Side view of a simple, helical burrow (FP4B). 5. Oblique view of a helical burrow with two small branches (FP1).
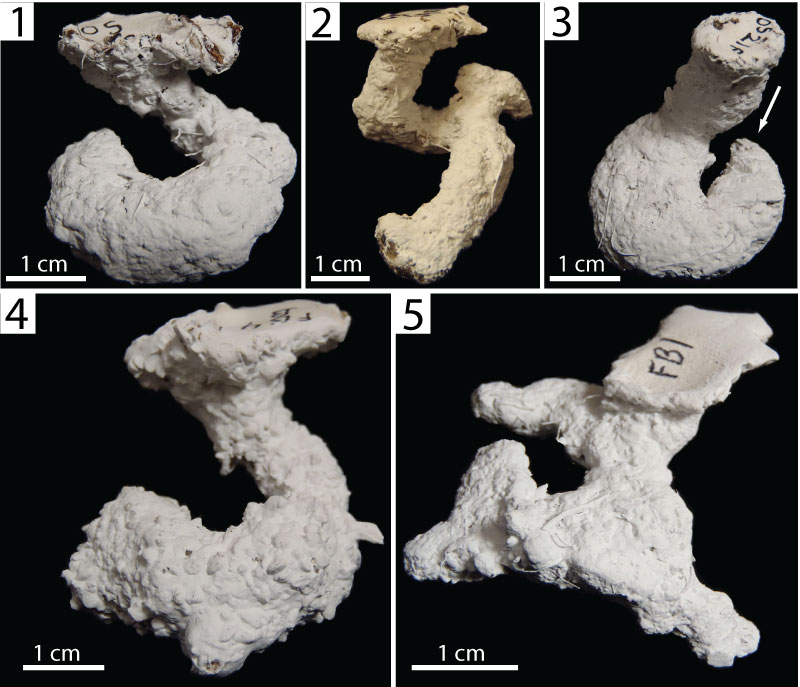
FIGURE 12. O-shaped burrows produced by Narceus americanus (1–4) and Floridobolus penneri (5–7). 1. Front oblique view of a horizontally oriented, Type 1 O-shaped burrow (NA29A). 2. Side view of a vertically oriented, Type 1 O-shaped burrow (NA26B). 3. Oblique view of the underside of a horizontally oriented, Type 2 O-shaped burrow with two surface openings (NA31A). 4. Side view of a Type 2 O-shaped burrow (NA31B). 5. Side view of a vertically oriented, Type 1 O-shaped burrow with two short branches (FP5F). 6. Front view of a vertically oriented, Type 1 O-shaped burrow with a chamber on one side of the O-shaped tunnel (FP6B). 7. Oblique side view of a Type 2 O-shaped burrow with a branch (FP5G).
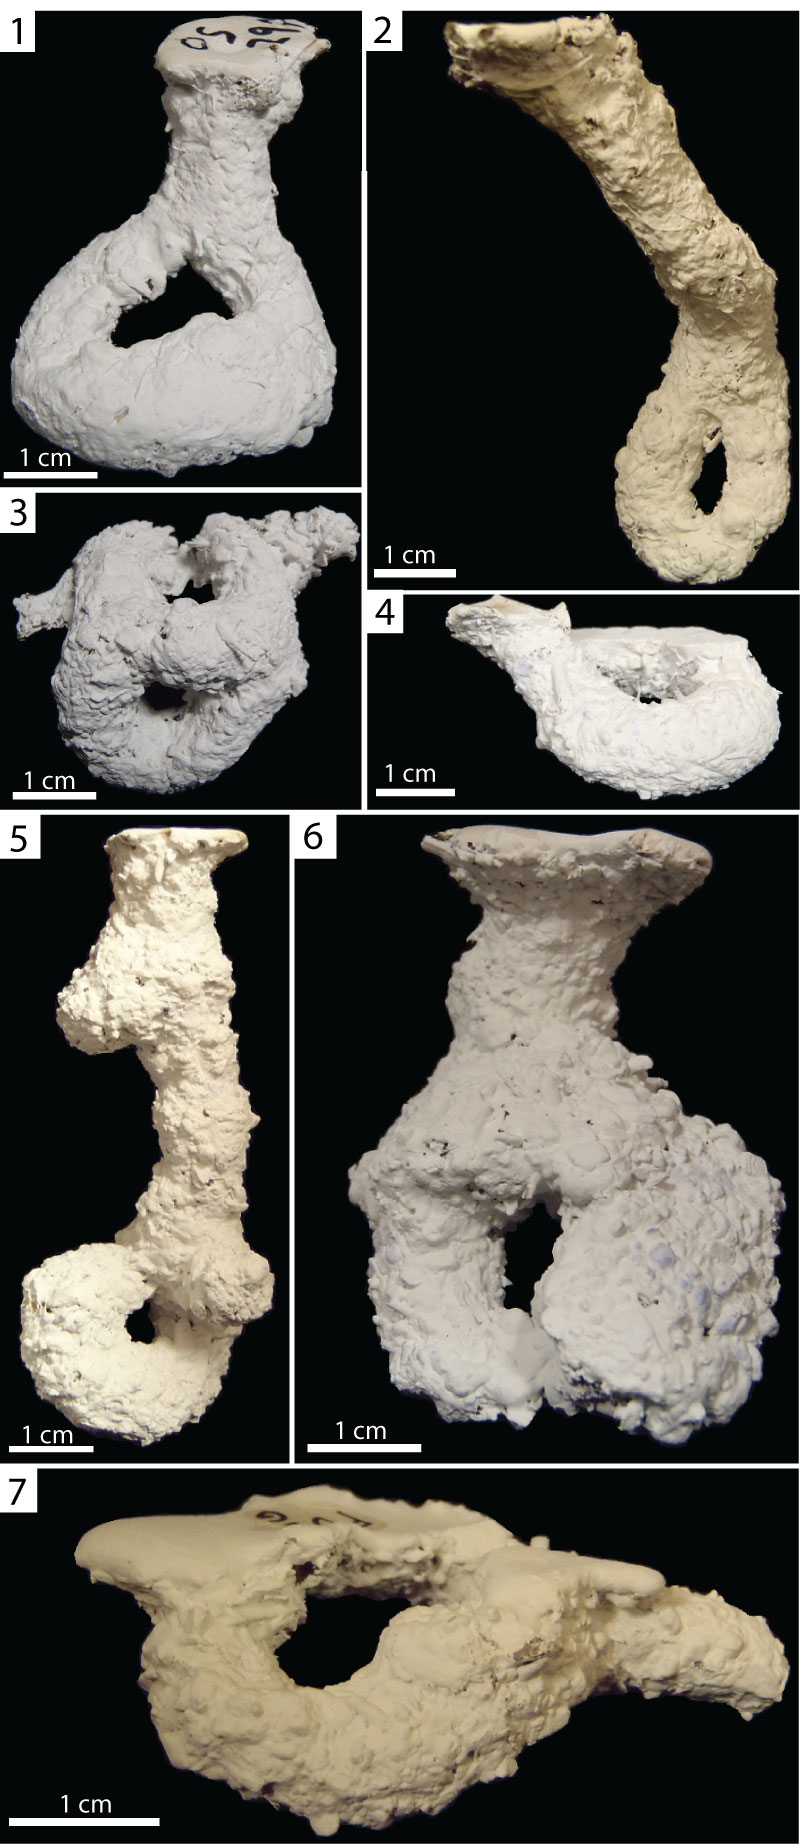
FIGURE 13. J-shaped burrows produced by Floridobolus penneri. 1. Front view of a simple, J-shaped burrow (FP2J). 2. Front view of a simple, J-shaped burrow (FP2I). 3. J-shaped burrow with a branch near the entrance (FP2H).
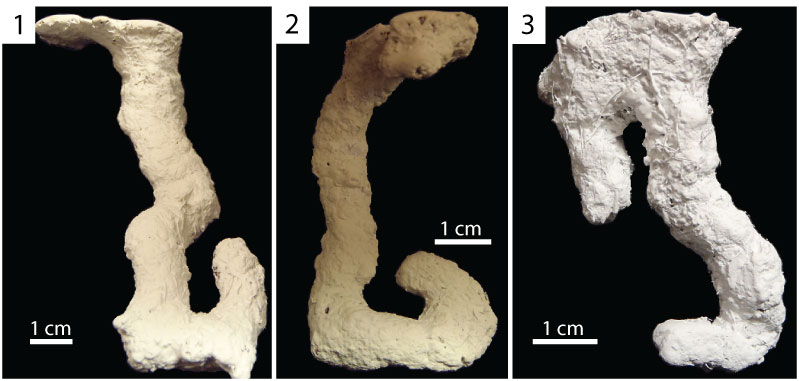
FIGURE 14. Summary of Bray Curtis similarity test results for the burrows of the four millipede species. Values are arithmetic means of the similarity values produced when burrows of similar or different architectures are compared. Total Avg columns represent the mean value of similarity when all burrows produced by one species are compared to those produced by itself or another species. Values of 0.9–0.8 indicate high similarity, 0.7–0.6 indicate moderate similarity, and values of 0.5 or less indicate dissimilarity. Values of 1.0 indicate that there was only one burrow produced of that architecture by that species.
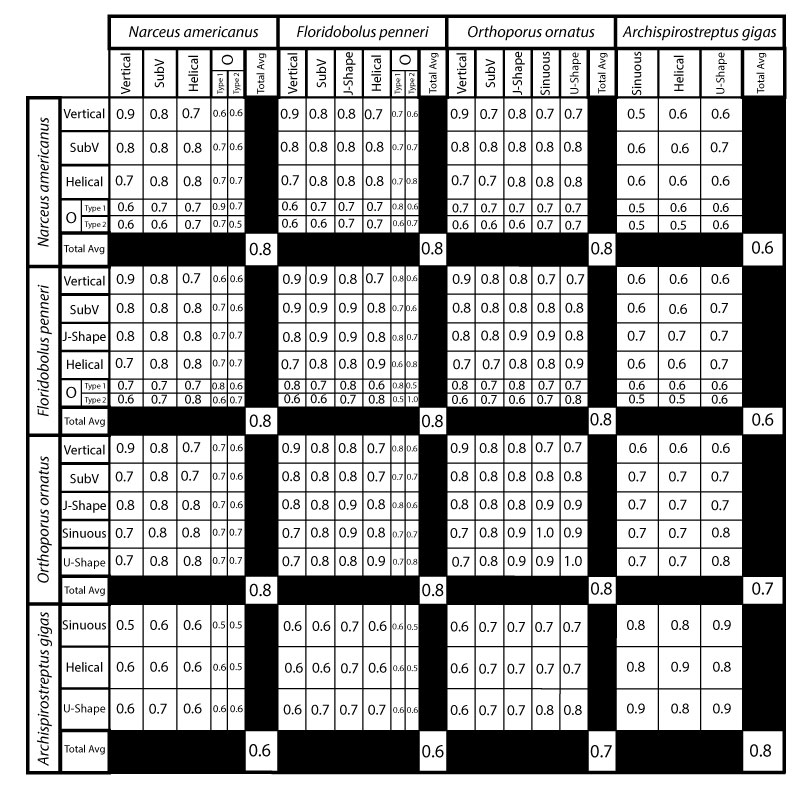
FIGURE 15. Bray Curtis cluster diagram comparing the 29 burrow casts produced by Narceus americanus. Burrow cast ID numbers are color coded by architecture: red = subvertical burrow; blue = vertical burrow; orange = helical burrow; purple = O-shaped burrow. Branch points near the top of the diagram indicate higher levels of similarity. Key branch points are marked with their similarity value (at arrows). Values > 0.80 indicate high similarity, 0.79–0.60 indicate moderate similarity, and values of 0.59 or less indicate dissimilarity. Groups of burrow casts found to be most similar are marked with brackets and their level of similarity.
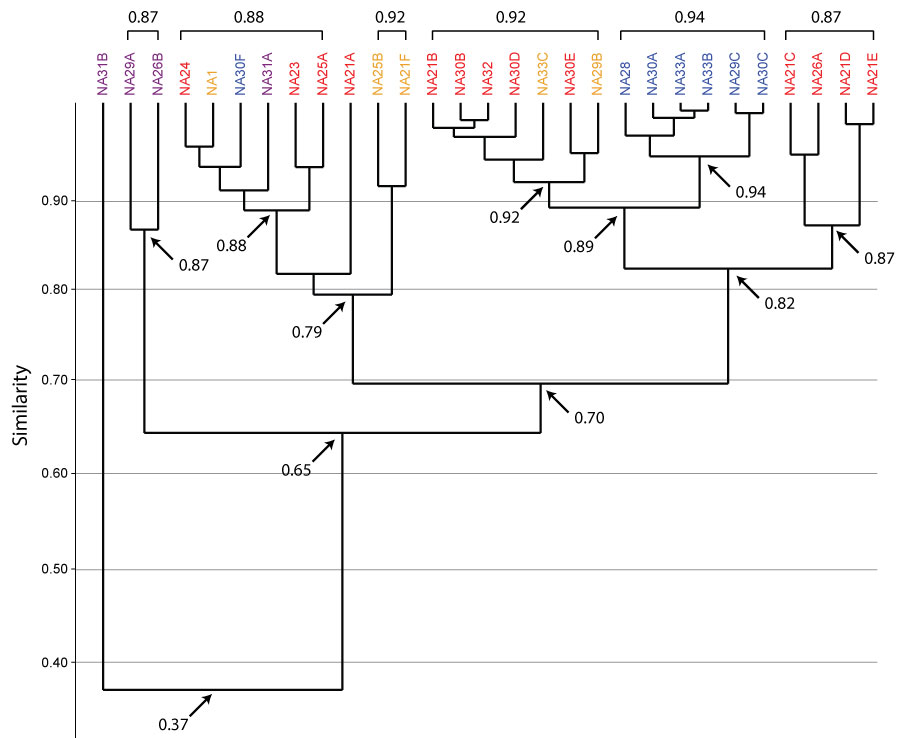
FIGURE 16. Bray Curtis cluster diagram comparing the 42 burrow casts produced by Floridobolus penneri. Burrow cast ID numbers are color coded by architecture: red = subvertical burrow; blue = vertical burrow; orange = helical burrow; purple = O-shaped burrow; green = J-shaped burrow. Branch points near the top of the diagram indicate higher levels of similarity. Key branch points are marked with their similarity value (at arrows). Values > 0.80 indicate high similarity, 0.79–0.60 indicate moderate similarity, and values of 0.59 or less indicate dissimilarity. Groups of burrow casts found to be most similar are marked with brackets and their level of similarity.
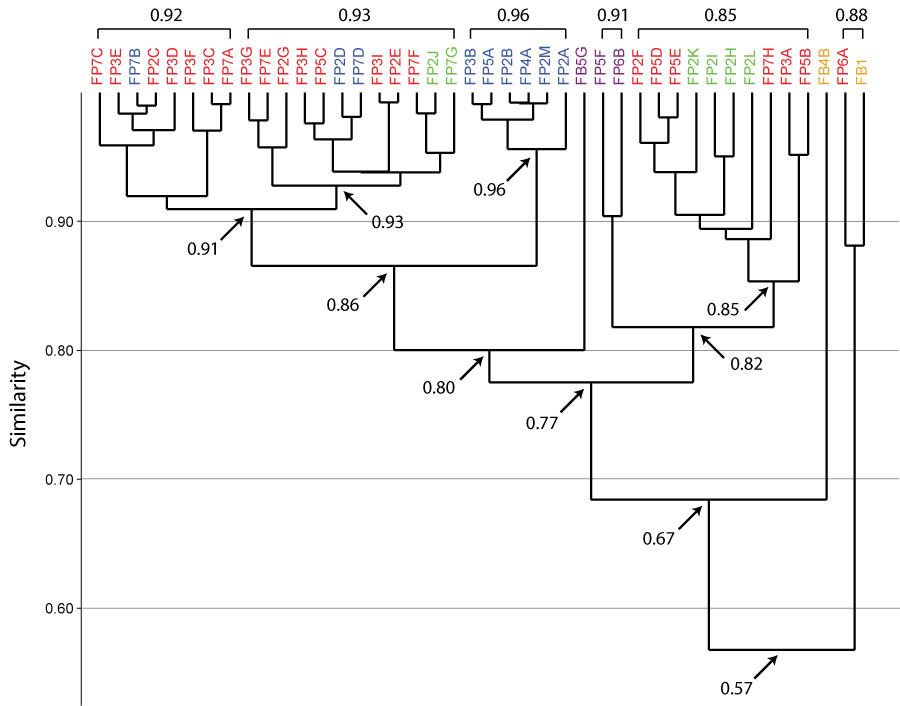
FIGURE 17. Bray Curtis cluster diagram comparing the 71 burrow casts produced by Narceus americanus (NA) and Floridobolus penneri (FP; shaded gray). Burrow cast ID numbers are color coded by architecture: red = subvertical burrow; blue = vertical burrow; orange = helical burrow; purple = O-shaped burrow; green = J-shaped burrow. Branch points near the top of the diagram indicate higher levels of similarity. Key branch points are marked with their similarity value (at arrows). Values > 0.80 indicate high similarity, 0.79–0.60 indicate moderate similarity, and values of 0.59 or less indicate dissimilarity. Groups of burrow casts found to be most similar are marked with brackets and their level of similarity.
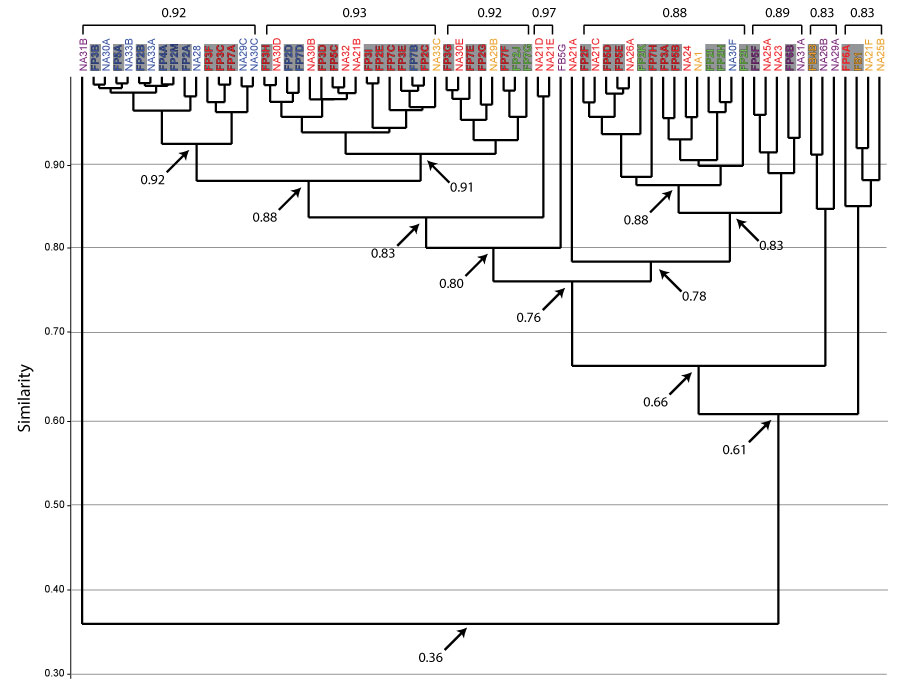
FIGURE 18. Bray Curtis cluster diagram comparing the 71 burrow casts produced by Narceus americanus (NA) and Floridobolus penneri (FP) with 13 burrow casts produced by Orthoporus ornatus (OO; shaded gray) from Hembree (2009). Burrow cast ID numbers are color coded by architecture: red = subvertical burrow; blue = vertical burrow; orange = helical burrow; purple = O-shaped burrow; green = J-shaped burrow. Branch points near the top of the diagram indicate higher levels of similarity. Key branch points are marked with their similarity value (at arrows). Values > 0.80 indicate high similarity, 0.79–0.60 indicate moderate similarity, and values of 0.59 or less indicate dissimilarity. Groups of burrow casts found to be most similar are marked with brackets and their level of similarity.
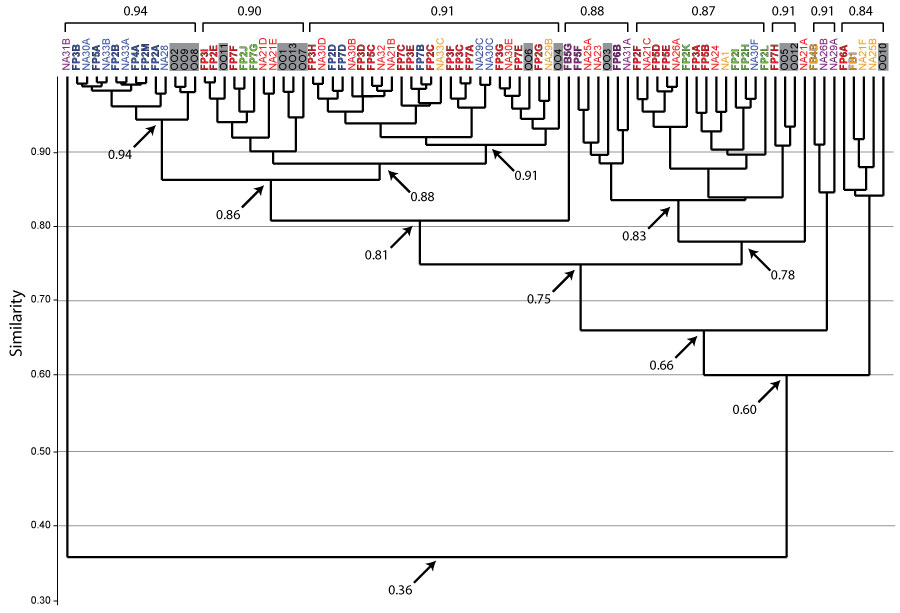
FIGURE 19. Bray Curtis cluster diagram comparing the 71 burrow casts produced by Narceus americanus (NA) and Floridobolus penneri (FP) with 8 burrow casts produced by Archispirostreptus gigas (AG; shaded gray) from Hembree (2009). Burrow cast ID numbers are color coded by architecture: red = subvertical burrow; blue = vertical burrow; orange = helical burrow; purple = O-shaped burrow; green = J-shaped burrow. Branch points near the top of the diagram indicate higher levels of similarity. Key branch points are marked with their similarity value (at arrows). Values > 0.80 indicate high similarity, 0.79–0.60 indicate moderate similarity, and values of 0.59 or less indicate dissimilarity. Groups of burrow casts found to be most similar are marked with brackets and their level of similarity.
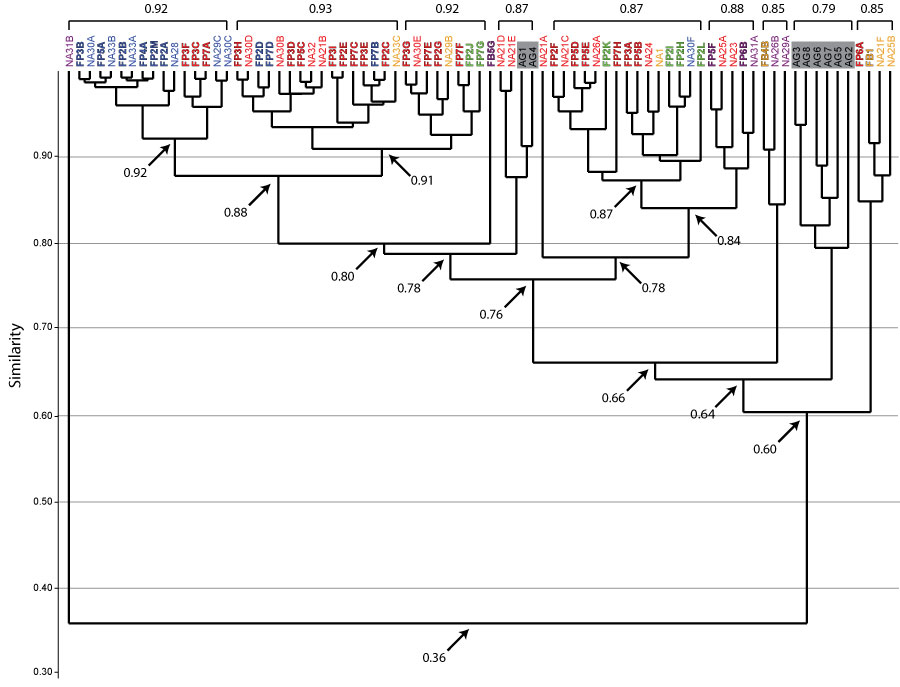
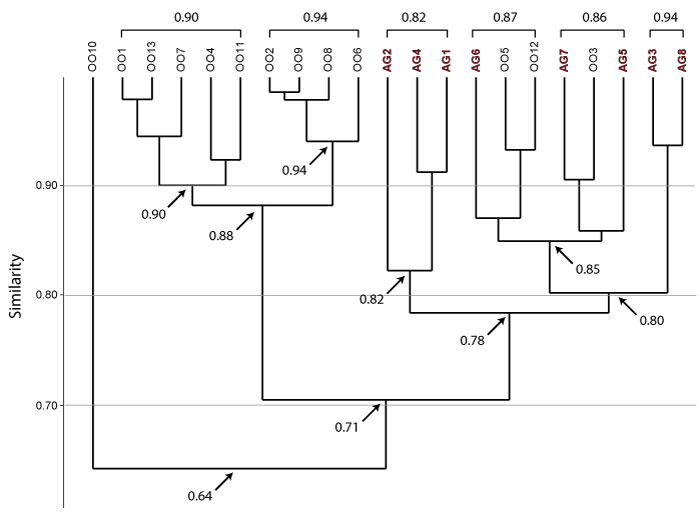
FIGURE 20. Bray Curtis cluster diagram comparing the 21 burrow casts produced by Orthoporus ornatus (OO) and Archispirostreptus gigas (AG). Branch points near the top of the diagram indicate higher levels of similarity. Key branch points are marked with their similarity value (at arrows). Values > 0.80 indicate high similarity, 0.79–0.60 indicate moderate similarity, and values of 0.59 or less indicate dissimilarity. Groups of burrow casts found to be most similar are marked with brackets and their level of similarity.