MATERIALS AND METHODS
This study examined molar teeth of gorillas, G. gorilla, housed at the
Field Museum of Natural History in Chicago, Illinois, USA. This taxon was chosen
because of the large body of work focused on primate dental functional anatomy
and because gorilla teeth evince substantial visible morphological change with
wear.
Kay (1981) has speculated that high
cusps and thin tooth enamel in primate folivores, such as the gorilla, would
lead to sharp edges at the sites of dentine exposure, which would improve
shredding and slicing abilities of the tooth with wear. Methods described here
were designed to examine such aspects of the morphology of worn teeth.
 Five
variably worn lower second molars were selected to include a range of wear from
unworn to extremely worn (Figure 1). High-resolution
replicas were prepared as follows. First, dental impressions were taken using
a polyvinylsiloxane putty (President's Jet, Coltene, Inc.). Molds were allowed
to harden, and casts were prepared using Epotek 301 resin and hardener (Epoxy
Technologies, Inc.). This procedure has been demonstrated to produce casts with
resolutions to less than one micron (Beynon 1987;
Ungar 1996), more than sufficient for
detailed analyses of the occlusal surfaces. Tooth replicas were then coated
with a thin layer of Magniflux Spotcheck SD-S2 Developer (Illinois Toolworks,
Inc.) to mitigate cast translucency.
Data Collection and Preparation
Data collection and preparation for analysis involved several steps. First,
three-dimensional point data representing the occlusal surface of each tooth
were collected. Data points for individual teeth were then aligned and scaled
and imported into the GRASS 4.1 (U.S. Army Construction Engineering Laboratory)
GIS package as a digital elevation model (DEM). Each DEM was then regridded and
cropped for analysis.
 We
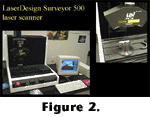
collected point data using a modified Surveyor 500 laser scanner with an RPS
450 laser (Laser Design, Inc.) (Figure 2). The scanner
has a maximum resolution of 0.0254 mm in x, y, and z dimensions and a maximum
work envelope of 152.4 mm x 152.4 mm x 304.8 mm. The laser can scan the occlusal table of a gorilla molar and record
hundreds of thousands of data points representing that surface in just a few
minutes. In this study, we created a DEM from points sampled at an interval
of 0.0508 mm. This resolution preserves subtle aspects of occlusal morphology,
yet limits data files to an easily manageable size.
This approach to data collection differs from those described by other authors.
Reed (1997) suggested using a reflex microscope
(Reflex Measurement Ltd.) to collect coordinate data for teeth. The reflex
microscope is, however, an impractical tool for dental topographic analysis. It
requires the researcher to identify each individual point on a tooth's surface,
an extremely tedious and time-consuming endeavor when hundreds if not hundreds
of thousands of points are needed to adequately characterize a tooth's surface.
In another study,
Zuccotti et al. (1998) suggested that a 3Draw
Pro (Polhemus Corp.) electromagnetic digitizer might be used to collect such
data. In that case, a stylus is passed over the occlusal surface, and points are
collected at a rate of 70 per minute. This procedure is impractical for smaller
mammalian teeth (including most primates) because the resolution of this
digitizer is only 0.13 mm. The MicroScribe-3D (Immersion Corp.) would have a
similar limitation, with a published accuracy of 0.38 mm (0.23 mm for the 3DX
model). Finally,
Jernvall and Selšnne (1999) suggested the use
of a confocal microscope. These authors used a Zeiss Axiovert 135M microscope
with the BioRad MRC-1024 confocal system and an American Laser Corporation 60WL
argon/krypton laser
.
This approach is very effective for digitizing small teeth, but is currently of
limited use in dental topographic analyses because the maximal working envelope
for the system described by Jernvall and Selšnne restricts tooth sizes to less
than 10 mm in diameter, somewhat smaller than many mammal teeth. The laser
scanner presents a good compromise between work envelope and resolution because
it is capable of collecting data for all but the smallest mammal teeth. (We have
resolved occlusal morphology on bat teeth less than 1 mm in diameter.) Laser
scanning can quickly generate a large dataset of points representing the
occlusal surfaces of most mammalian molar teeth.
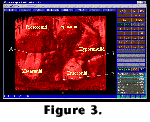
 Once
data were collected, individual DEMs had to be aligned and scaled so that measurements
would be consistent among specimens. This was accomplished using three points:
the lowest points on the anterior and posterior foveae and the junction between
crests connecting the metaconid and entoconid (Figure 3).
These landmarks were chosen because they are the lowest points consistently
identifiable on the occlusal surface, thereby allowing inclusion of the most
worn teeth in this study. Data Sculpt software (Laser Design, Inc.) was used
to align these three points to the x-y plane, with the x-axis passing through
the two foveae. Each tooth was then scaled to the mean distance separating pairs
of landmarks on that tooth. The aligned and scaled DEMs were exported in ASCII
data files as x, y, z data points to the GRASS 4.1 (U.S. Army Construction Engineering
Laboratory) GIS software package.
Because rotational alignment of data results in an irregular matrix,
inverse-distance weighting was used to re-grid the coordinates to a regularly
spaced surface model. In order to further assure the comparability of specimens,
each DEM was cropped to the horizontal plane intersecting the lowest point on
the occlusal surface. This also eliminated the problem of surface overhang (more
than one z-value for an x-y pair), such as often occurs down the buccal and
lingual sides of the tooth as the enamel cap approaches the cervix. Individual
cusps were delineated on the basis of contour lines (isometric lines connecting
points of identical elevation). The areas defined by individual cusps were used
as masks to filter out data from other parts of the tooth. This allowed separate
consideration of data for each cusp.
Once the DEM was aligned, scaled, and cropped, we used standard GIS algorithms
to compute descriptive statistics for each cusp. These included average slope,
average delta slope (the second derivative of elevation), topographic aspect or
surface orientation (in thirty-degree increments), surface area, and a relief
index. The relief index is a ratio of three-dimensional surface area to
two-dimensional (x, y) surface area. We also calculated the volume of fluid
required to "fill" the central basin of each tooth to the point that
it would overflow. This is a useful and repeatable measure of basin volume that
reflects the morphology of the tooth.

 Five
variably worn lower second molars were selected to include a range of wear from
unworn to extremely worn (Figure 1). High-resolution
replicas were prepared as follows. First, dental impressions were taken using
a polyvinylsiloxane putty (President's Jet, Coltene, Inc.). Molds were allowed
to harden, and casts were prepared using Epotek 301 resin and hardener (Epoxy
Technologies, Inc.). This procedure has been demonstrated to produce casts with
resolutions to less than one micron (Beynon 1987;
Ungar 1996), more than sufficient for
detailed analyses of the occlusal surfaces. Tooth replicas were then coated
with a thin layer of Magniflux Spotcheck SD-S2 Developer (Illinois Toolworks,
Inc.) to mitigate cast translucency.
