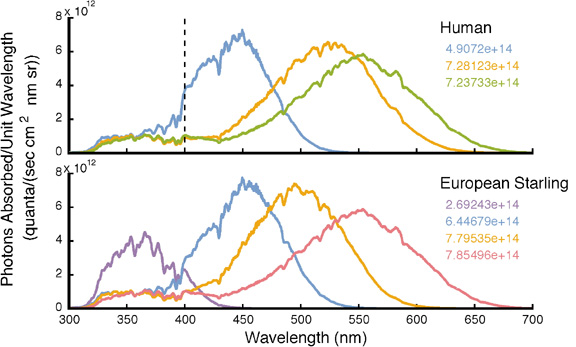
Figure 7B. Cone signals. Analogous to the operations shown in Figure 6B, these seven curves represent the product of a skylight spectrum and the seven absorption spectra of Figure 7A. The inset numbers are the integrals of the seven curves. These numbers represent essentially all the information that the nervous system retains about the average and spectral intensity of the skylight's radiance.
