METHODS AND MATERIALS
 A
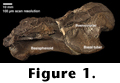
total of six bones from the braincase of a juvenile Tylosaurus
sp. were available for three-dimensional laser scanning; the right and left
prootic, the right quadrate, the supraoccipital, the parietal, and the
basisphenoid-basioccipital. The basisphenoid-basioccipital (Fig.
1) was chosen for this initial evaluation because of its complex surfaces
and its importance in revealing the positions and paths of cranial nerves.
A
total of six bones from the braincase of a juvenile Tylosaurus
sp. were available for three-dimensional laser scanning; the right and left
prootic, the right quadrate, the supraoccipital, the parietal, and the
basisphenoid-basioccipital. The basisphenoid-basioccipital (Fig.
1) was chosen for this initial evaluation because of its complex surfaces
and its importance in revealing the positions and paths of cranial nerves.
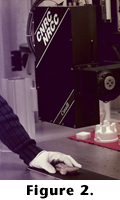 The
Institute for Information Technology (a division of the National Research
Council of Canada NRCC) developed the 3D laser scanner (Fig.
2) that was used. This scanner is able to generate extremely accurate scans
at resolutions of as little 10 µm. Scanning at such high resolutions
requires significant time for both scanning the object because the laser must
physically travel slower over the object and using substantially more computer
processing time in order to generate the 3D model. Previous analysis of the
accuracy of the 3D laser scanner used in this study for industrial prototyping
purposes indicates that distortion-free models can be generated down to a
resolution of 10 µm (Beraldin et
al. 1997).
The
Institute for Information Technology (a division of the National Research
Council of Canada NRCC) developed the 3D laser scanner (Fig.
2) that was used. This scanner is able to generate extremely accurate scans
at resolutions of as little 10 µm. Scanning at such high resolutions
requires significant time for both scanning the object because the laser must
physically travel slower over the object and using substantially more computer
processing time in order to generate the 3D model. Previous analysis of the
accuracy of the 3D laser scanner used in this study for industrial prototyping
purposes indicates that distortion-free models can be generated down to a
resolution of 10 µm (Beraldin et
al. 1997).
Even a 50 µm-resolution scan allows for extremely
detailed and accurate reproductions of objects. But even at this resolution it
is done at the expense of generating very complex polygonal models with numerous
individual polygons. Due to the complex surfaces present on the
basisphenoid-basioccipital, we estimated that scanning the bone at a resolution
of 50 µm would generate a model composed of over ten million polygons. As one
might guess, models composed of such large numbers of polygons cause significant
problems for present-day computer technology and generally require prohibitively
expensive technology to generate. For this reason, prior to carrying out a full
scan of the basisphenoid-basioccipital, a series of test scans were carried out
at resolutions at both 50 µm and at 100 µm on a small 1 cm2 area.
Based on these tests, it was determined that a resolution of 100 µm produced
satisfactory results and manageable polygon counts.
Having determined a satisfactory scan resolution,
the basisphenoid-basioccipital was scanned 30 times in a variety of orientations
to allow all surfaces to be exposed to the laser. The information captured by
the laser scanner was compiled on a Silicon Graphics workstation. These 3D
datasets were then imported into a software package developed by InnovMetric
Software Inc. called PolyWorks/Modeler version 5.0. Using the automatic
alignment technology built into PolyWorks/Modeler, the multiple datasets from
the 30 scans in different coordinate systems were unified into a single
coordinate system, forming the 3D surface. PolyWorks/Modeler's high-precision
alignment algorithm allows unrestricted movement of either the object or the
digitizer to measure the entire shape of the object without any external
reference (Beraldin et al. 1997).
The 3D laser scanner employed at NRCC is also able
to capture color information for each positional coordinate. Once this
information is passed to Polyworks/Modeler, a texture map is generated and
applied to the digital model. A note should be made about color. The NRCC 3D
laser scanner uses three different wavelength (red, green, and blue) lasers to
register accurate data on color reflectance (Soucy
et al. 1996). As the lasers do not depend on ambient light for color
determination, the texture maps generated from the color information are
accurate (Beraldin et al. 1997).
However, there is variation in the color information when the model is displayed
on cathode ray tube (CRT) or liquid crystal display (LCD) monitors or when
images are printed. This variation is due to limitations and individual
variations in how different computers' video cards and CRT-LCD monitor display
color information (Fraser 1998).
The completely assembled 100 µm resolution
digital model was composed of over 3 million polygons and totaled over 76
megabytes (MB) in size. To provide an indication of how file sizes balloon with
increasing resolution, the 1 cm2 test area scanned at a 50 µm
resolution alone. This resulted in a model composed of 870,000 polygons and was
23.5 MB in size. In contrast, the same area scanned at 100 µm produced an 11.75
MB file comprised of 235,000 polygons. The completed models were saved as an
InnovMetric polygon file (.pol). This proprietary file format is efficient and
preserves texture information as well as the coordinate system that forms the
basis for the model.
It was necessary to perform a series of polygon
reductions to diminish the complexity and storage size of the model and to allow
for interpretation and viewing of the model on typical desktop computer systems.
The completed 100 µm resolution model described above was reduced to three
models composed of 800,000 (21 MB), 100,000 (2.6 MB), and 50,000 (1.3 MB)
polygons, respectively. As part of this evaluation, the polygon count for the 1
cm2 test area scanned at 50 µm resolution was also
reduced from 870,000 polygons to 50,000 polygons (1.3MB). Prior to this
reduction, still images of both the complete 3 million polygon model (100 µm
scan resolution) and the 1 cm2 area scanned at 50 µm resolution were
rendered and saved in JPEG file format.
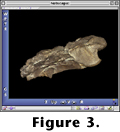 All
reduced polygon files were converted from the proprietary InnovMetric file
format to VRML (ver. 2.0) (Fig.3). The
VRML format is a standard text-based 3D file format that allows for viewing of
the files over the World Wide Web. Unfortunately as this file format is
text based, file sizes increase dramatically.
All
reduced polygon files were converted from the proprietary InnovMetric file
format to VRML (ver. 2.0) (Fig.3). The
VRML format is a standard text-based 3D file format that allows for viewing of
the files over the World Wide Web. Unfortunately as this file format is
text based, file sizes increase dramatically.
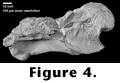 Both
the original .pol files and the VRML files were transferred to Carleton
University from NRCC for manipulation and analysis on both Apple Macintosh and
IBM compatible PCs. The VRML files were viewed and evaluated using a software
package from Auto-des-sys Inc. entitled Form-Z (ver 3.1.4). This
software application allowed for relatively rapid display of the 3D models and
corrected the problems encountered when using Intervista. Using Form-Z, the
texture map could be removed and the model could be analyzed without color bias (Fig.
4).
Both
the original .pol files and the VRML files were transferred to Carleton
University from NRCC for manipulation and analysis on both Apple Macintosh and
IBM compatible PCs. The VRML files were viewed and evaluated using a software
package from Auto-des-sys Inc. entitled Form-Z (ver 3.1.4). This
software application allowed for relatively rapid display of the 3D models and
corrected the problems encountered when using Intervista. Using Form-Z, the
texture map could be removed and the model could be analyzed without color bias (Fig.
4). 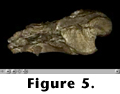 To
decrease the file size and to allow for greater access to the model, a QuickTime
VR object was created (Fig. 5) using
Form-Z's export to a QuickTime VR feature. Scanning the
basisphenoid-basioccipital at 100 µm required four hours, with an additional 3
hours of postproduction time used to compile, assemble, and reduce the model.
To
decrease the file size and to allow for greater access to the model, a QuickTime
VR object was created (Fig. 5) using
Form-Z's export to a QuickTime VR feature. Scanning the
basisphenoid-basioccipital at 100 µm required four hours, with an additional 3
hours of postproduction time used to compile, assemble, and reduce the model.
