![]()
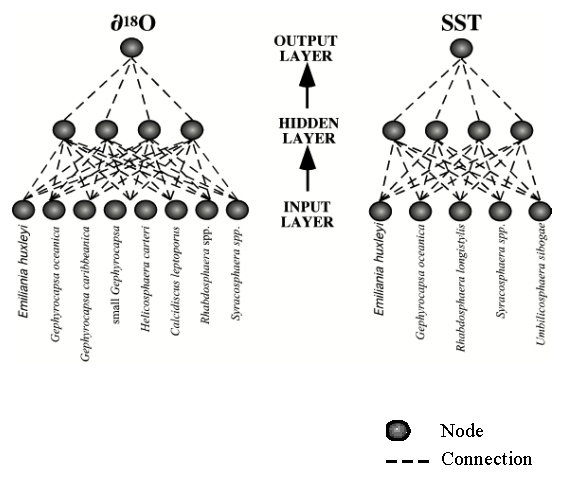
Figure 2. Diagram showing the network structure with five-input and eight-input neurons, corresponding to the number of species of nannoplankton used as input signals in the Californian and Mediterranean studies, respectively. This is an example comprising one hidden layer with four neurons and an output layer with a single neuron, corresponding to the variable to be predicted.