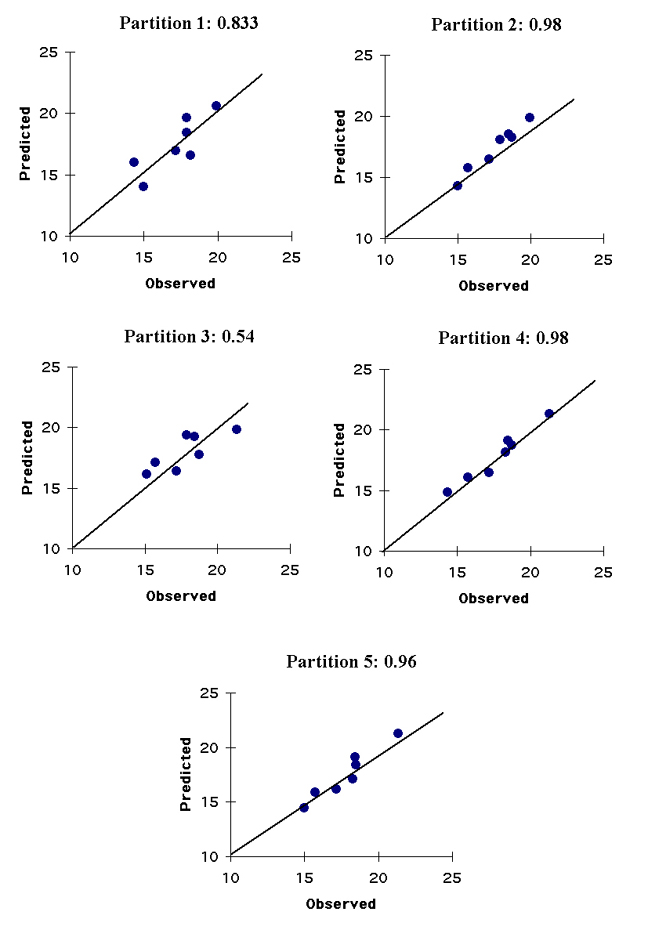
Figure 4. The correlation coefficients between observed and predicted SST's in the five test-sets of the Californian samples are as follows: Partition 1: 0.83; Partition 2: 0.98; Partition 3: 0.54; Partition 4: 0.98; and Partition 5: 0.96.