Stage-level ranges for Albian-Recent cheilostome and cyclostome bryozoan genera were provided by J. J. Sepkoski, Jr. from his unpublished global genus database. Accuracy of the database was checked by us, resulting in various alterations to about 20 percent of the records, largely changes in ranges but also including elimination of some synonyms, addition of some genera, and reassignment of a few genera from cyclostomes to cheilostomes or vice versa. This proportion of errors is consistent with the findings of Adrain and Westrop (2000) for trilobites in Sepkoskis database, and like they, we found that the error was randomly distributed, so that results of analyses based on the database did not differ greatly between the original and corrected versions.
![]() The
analysed data comprised 808 genera (545 cheilostomes; 263 cyclostomes), of which
24 percent are confined to one stage. Origination and extinction metrics were
calculated both with and without such stage-only genera. Error bars for the
origination and extinction metrics were calculated using the Percentage
Error Bars program, freeware available from Steve Holland.
The program is based on a calculation procedure given in Raup
(1991).
The
analysed data comprised 808 genera (545 cheilostomes; 263 cyclostomes), of which
24 percent are confined to one stage. Origination and extinction metrics were
calculated both with and without such stage-only genera. Error bars for the
origination and extinction metrics were calculated using the Percentage
Error Bars program, freeware available from Steve Holland.
The program is based on a calculation procedure given in Raup
(1991).
The Gradstein and Ogg (1996) timescale was used for stage boundary dates. Numbers of appearances and disappearances, hereby referred to as originations and extinctions respectively, per stratigraphic interval constitute the raw data and must be calibrated in order to be of most use. The method of calibration, however, has not been standardised, with extinctions and originations variously being presented as (1) number per million years (N/myr); (2) proportion of standing diversity (i.e., per capita rate; N/D); and (3) number per million years as a proportion of standing diversity (N/D/myr). In addition, one may include or exclude taxa that are confined to the stratigraphic interval being studied (e.g., stage, series). Foote (1994) used Monte Carlo simulations to examine the validity of extinction and origination metrics. He concluded that normalising per-taxon extinction rate by introducing uniform time intervals (e.g., per million years) potentially introduces bias, especially for extinction metrics. Apparently, the problem cannot be entirely avoided, but For comparing extinction intensity over a small number of intervals, it may still be safest to check for concordance among several metrics (Foote 1994, p. 442). In this paper, we present the three types of metrics listed above, both with and without taxa confined to a single stage, and examine degree of concordance among them.
 Recently,
Foote (2000b) discussed
problems of bias in origination and extinction rates due to incomplete knowledge
of temporal distribution of taxa, the effects of variable interval length (e.g.,
in the analysis here, stages vary over almost an order of magnitude, from 1.6 to
13.3 myr), and possible secular trends in probability of preservation. He
reviewed the various measures used to estimate origination and extinction rates
and advocated use of measures in which interval-only taxa (singletons)
become irrelevant, because both their inclusion or exclusion can introduce
error. Such measures, therefore, are based only on taxa that cross range
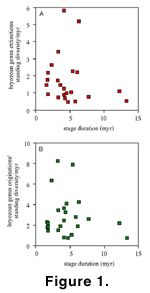
boundaries. We have nonetheless used the more straightforward calculations of
origination and extinction rates as described above. We have done so for three
reasons. First, we find no systematic effect of increased stage duration on
rates of origination and extinction in our data (Figure
1). Secondly, exclusion and inclusion of stage-only genera produces only
minimal differences in the rates plotted, and in some instances is of interest
in itself. Thirdly, the major points of interest in the study (i.e., the
anomalously high Maastrichtian and Danian extinction rates) are so far above
background rates that they should stand out in virtually any method of
calculation of rates.
Recently,
Foote (2000b) discussed
problems of bias in origination and extinction rates due to incomplete knowledge
of temporal distribution of taxa, the effects of variable interval length (e.g.,
in the analysis here, stages vary over almost an order of magnitude, from 1.6 to
13.3 myr), and possible secular trends in probability of preservation. He
reviewed the various measures used to estimate origination and extinction rates
and advocated use of measures in which interval-only taxa (singletons)
become irrelevant, because both their inclusion or exclusion can introduce
error. Such measures, therefore, are based only on taxa that cross range
boundaries. We have nonetheless used the more straightforward calculations of
origination and extinction rates as described above. We have done so for three
reasons. First, we find no systematic effect of increased stage duration on
rates of origination and extinction in our data (Figure
1). Secondly, exclusion and inclusion of stage-only genera produces only
minimal differences in the rates plotted, and in some instances is of interest
in itself. Thirdly, the major points of interest in the study (i.e., the
anomalously high Maastrichtian and Danian extinction rates) are so far above
background rates that they should stand out in virtually any method of
calculation of rates.
![]()