![]()
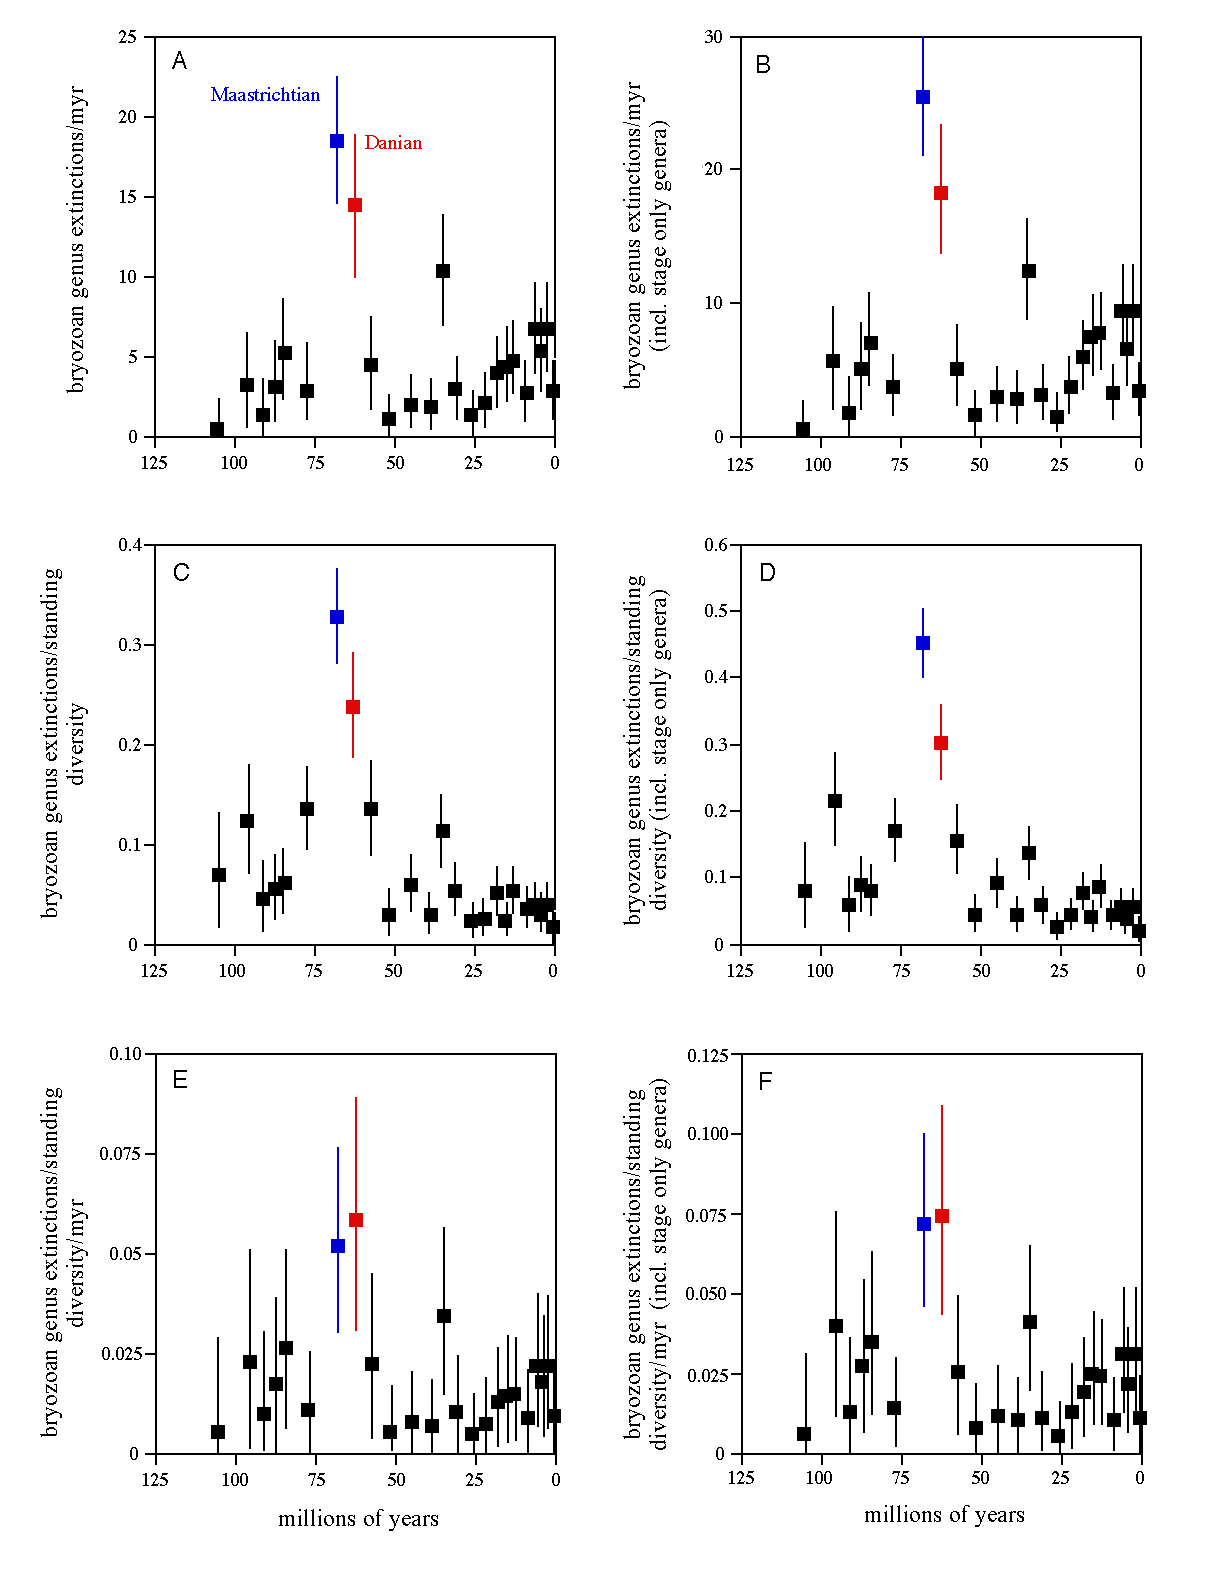
Figure 4. Total bryozoan (cyclostome plus cheilostome) generic extinctions by stage. A, B. Extinctions per million years. C, D. Extinctions per standing diversity. E, F. Extinctions per standing diversities per million years. Graphs on the left do not include genera known only from a single stage, and those on the right do include stage-only genera. Error bars represent 95% confidence intervals.