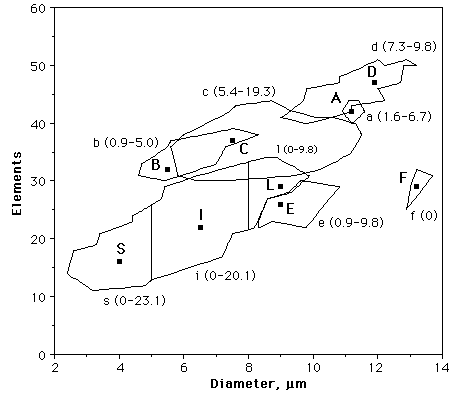
Figure 4. Taxonomic scheme of C. leptoporus morphotypes (from Knappertsbusch, 2000), that was applied during the present study. Black squares indicate the positions of frequency modes of individual morphotypes (labelled with large letters). The closed lines encircle the morphological variability for each morphotype (labelled with small letters). The numbers in parentheses indicate the temporal range of morphotypes in millions of years.
