| Case study 10 - Jurassic fossil associations from England and Normandy |
Data file: jurass.dat
The Upper Jurassic (Corallian) shelly faunas of Dorset are dominated by mainly bivalves and gastropods and occur within a shallow marine sequence. A wide variety of facies, through a number of regressive cycles, are developed including offshore calcareous sandstones together with limestones, nearshore mudstones, sandbar deposits and lagoonal mudstones. Fürsich (1977) has described nearly twenty faunal and ichnofaunal associations from the Upper Jurassic outcrops of Dorset, Oxfordshire and Normandy.
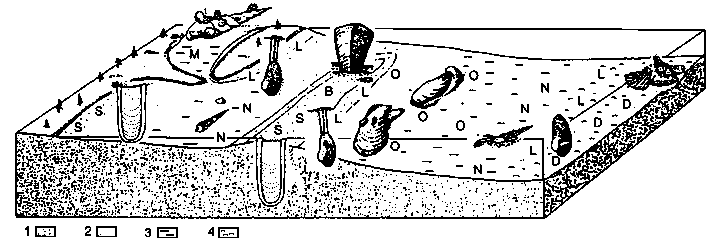
This case study concentrates on the most common elements of six Corallian associations. Organisms with a relative frequency of less than 1% have not been considered in this simplified analysis. Nevertheless data for 54 genera, virtually all bivalves, are presented for the following six associations illustrated by Fürsich (1977, text-fig. 31): Pseudomelania heddingtonensis association, Pleuromya uniformis association, Pinna association, Oyster/Isognomon promytiloides association, Corbulomima association, Myophorella clavellata association. These are give in order, from nearshore Pseudomelania to offshore Myophorella. The components of the associations are listed in Fürsich (1977); information for this exercise was extracted from raw data held in the British Library, Boston Spa.

Schematic distribution of Corallian bivalve-dominated associations
(modified from Fürsich 1977, text-fig. 31 with
permission from the Palaeontological Association).
B: Pinna assoc. D: Myophorella assoc.
L: Pleuromya assoc. M: Pseudomelania assoc.
N: Corbulomina assoc. O: Oyster/Isognomon assoc.
S: Diplocraterion assoc.
1: Sand. 2: Silt. 3: Clay and argillaceous & micritic
limestones. 4: Condensed sandstones and limestones.
Select 'Diversity' in the Statistics menu and inspect the overall dominance, evenness and diversity indices across the six associations listed. Are there differences between the structures of shallow-water assemblages, say the Pseudomelania heddingtonensis and Pleuromya uniformis associations and those such as the Corbulomima and Myophorella clavellata associations, located in more seaward positions?
You may also want to try rarefaction analysis on this sample, in order to compare the number of species in the samples corrected for sample size. You should perform the rarefaction analysis (in the Statistics menu) on the Pleuromya sample, which has the largest number of individuals (2723). Compare the number of taxa in the smaller samples with the expected number as given by the rarefaction table.
We will now apply Detrended Correspondence Analysis. Transpose the matrix back again, and select 'Detrended correspondence' in the Multivariate menu. Tick the 'Column labels' and the 'Detrending' boxes. Is the onshore-offshore gradient recognizable along either of the ordination axes? What might the other axis signify?
Can you find any trace of the onshore-offshore gradient using Principal Components Analysis?