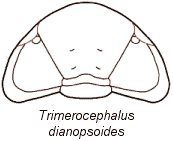
Drawing by Sam Gon III. Used with permission.
| Case study 4 - Shape change through trilobite ontogeny |
Data file: outlines.dat
| Crônier et al. (1998) studied the ontogeny of the Late Devonian phacopid trilobite Trimerocephalus lelievrei from Morocco. Well-separated size classes (growth stages) were identified, and the changing shape of the cephalon through ontogeny was studied using Elliptic Fourier shape analysis. This case study uses the original outline data set, kindly provided by Catherine Crônier. |  Drawing by Sam Gon III. Used with permission. |
Open the file outlines.dat and commatize if necessary. Each cephalon outline is represented by two columns containing 64 x/y co-ordinate pairs. There are 7 cephala from growth stage A, 16 from stage B, 18 from stage C, 9 from stage D and 1 from stage E.
Using the 'XY graph' option in the Plot menu, inspect one outline from each group. Can you detect any change in shape through ontogeny?
Use the Copy button under the Elliptic Fourier data matrix. Clear the main spreadsheet (e.g. with 'New' in the File menu) and paste the 51 rows of Fourier coefficients into the empty spreadsheet (Edit menu). Assign different colors to the different size classes (Edit menu), remembering the numbers of cephala contained in each class as given above.
Now choose 'Principal components' in the Multivar menu, using the
Var-Covar option. View the loadings, and note how the most important
components are related to long-wavelength features (low harmonic number).
View the scatter diagram. Can you see any directed shape change through
ontogeny?
|
Stage A: Black dots Stage B: Red crosses Stage C: Blue squares Stage D: Green crosses Stage E: Purple circle |