VISUALIZATION AND RECONSTRUCTION
Slice videos
 Computer
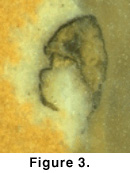
video files can be assembled directly from the datasets resulting from grinding
(see Appendix
1, section 2), providing a simple way of leafing backwards and forwards
through the slice images (Figure 3).
These files form an invaluable tool for the exploration of datasets and,
although less striking than full three-dimensional reconstructions, are often
more useful for tracing the origins and termination of small or obscure
structures. Nonetheless, they do not constitute a three-dimensional
reconstruction in the accepted sense and are best used to complement rather than
substitute for such reconstructions.
Computer
video files can be assembled directly from the datasets resulting from grinding
(see Appendix
1, section 2), providing a simple way of leafing backwards and forwards
through the slice images (Figure 3).
These files form an invaluable tool for the exploration of datasets and,
although less striking than full three-dimensional reconstructions, are often
more useful for tracing the origins and termination of small or obscure
structures. Nonetheless, they do not constitute a three-dimensional
reconstruction in the accepted sense and are best used to complement rather than
substitute for such reconstructions.
Construction of three-dimensional models
 The
surfaces method. Two methodologies exist for the construction of
three-dimensional models from data based on slices (Brown
and Herbert 1996; Herbert 1999).
The first, the surfaces approach (Herbert
1999; see also Chapman
1989), begins with a manual interpretation step, tracing all structures of
interest from each slice image (Figure
4.1-4.3). Traced outlines are digitized into line segments forming closed
loops (Figure 4.4). The reconstruction
algorithm assembles these stacked two-dimensional loops into a three-dimensional
geometry, typically a mesh of triangular facets (Figure
4.5), which can be rendered into a two-dimensional view by a number of
standard computer graphics techniques. The two key advantages of this method are
that it, (1) does not require photographic images of the slices and, (2) is
capable of working with low-quality, sparsely-spaced data. Neither of these is
relevant to the present study. This method also has several disadvantages,
especially in the context of the Herefordshire fauna. The initial interpretation
stage is extremely time-consuming when a large number of slice images are
involved, and also threatens the objectivity of the reconstruction as structures
must be delineated before the three-dimensional form becomes apparent. When the
margins of the fossil structures are unclear (as is often the case with the
Herefordshire fossils), there is a danger that subjective interpretations will
influence the reconstructed morphology. In addition, the algorithmic
reconstruction of stacked two-dimensional loops into three-dimensional surfaces
is subject to the correspondence problemthat is, the difficulty of
determining the manner in which loops in subsequent slices connect to each
other. Herbert (1999) approached
this problem with algorithms that made a priori assumptions about the
morphology of the object to be reconstructed, an approach that is clearly not
viable for the reconstruction of poorly understood morphologies such as those of
many Herefordshire
fossils. Other available approaches require the user to determine
correspondence, a procedure that is both time consuming and represents another
potential source of subjectivity.
The
surfaces method. Two methodologies exist for the construction of
three-dimensional models from data based on slices (Brown
and Herbert 1996; Herbert 1999).
The first, the surfaces approach (Herbert
1999; see also Chapman
1989), begins with a manual interpretation step, tracing all structures of
interest from each slice image (Figure
4.1-4.3). Traced outlines are digitized into line segments forming closed
loops (Figure 4.4). The reconstruction
algorithm assembles these stacked two-dimensional loops into a three-dimensional
geometry, typically a mesh of triangular facets (Figure
4.5), which can be rendered into a two-dimensional view by a number of
standard computer graphics techniques. The two key advantages of this method are
that it, (1) does not require photographic images of the slices and, (2) is
capable of working with low-quality, sparsely-spaced data. Neither of these is
relevant to the present study. This method also has several disadvantages,
especially in the context of the Herefordshire fauna. The initial interpretation
stage is extremely time-consuming when a large number of slice images are
involved, and also threatens the objectivity of the reconstruction as structures
must be delineated before the three-dimensional form becomes apparent. When the
margins of the fossil structures are unclear (as is often the case with the
Herefordshire fossils), there is a danger that subjective interpretations will
influence the reconstructed morphology. In addition, the algorithmic
reconstruction of stacked two-dimensional loops into three-dimensional surfaces
is subject to the correspondence problemthat is, the difficulty of
determining the manner in which loops in subsequent slices connect to each
other. Herbert (1999) approached
this problem with algorithms that made a priori assumptions about the
morphology of the object to be reconstructed, an approach that is clearly not
viable for the reconstruction of poorly understood morphologies such as those of
many Herefordshire
fossils. Other available approaches require the user to determine
correspondence, a procedure that is both time consuming and represents another
potential source of subjectivity.
Volume-based methods. The second reconstruction methodology, that of volume-based reconstruction, is preferred in the present study. Volume representation is a three-dimensional extension of raster or bitmap representations of two-dimensional images, in which an image is modelled as a rectangular array of regularly spaced pixels. A volume dataset thus consists of a three-dimensional array of regularly spaced volume elements or voxels, each stored as a number representing the value of some property of the object at that point. The sequential slice images generated by the grinding technique (after minor post-processing see Appendix 1, section 3), represent a volume of this sort in which the values of the voxels represent the reflectivity of the surface as captured by the digital camera. Volume-based three-dimensional reconstructions, largely utilizing datasets from MR or CT scanners, are routinely used in medical applications and have been used to produce volume-based reconstructions of fossils (e.g., Hamada et al. 1991; Torres 1999). These methods have also been applied to optically captured volumes. Brown and Herbert (1996) attempted to produce volume-based models from serial section data, although the low resolution of the graptolite sections on which that work was based precluded a successful reconstruction. More successfully, Hammer (1999) reconstructed a halysitid coral colony from volume data obtained by serial grinding and captured with a flatbed scanner.
 Volume
rendering. There are various techniques, collectively known as volume
rendering, for the direct visualization of volume data . Although they vary in
detail, all involve forms of ray casting, where the computer calculates an
array of virtual light rays shone into the volume from a specified angle,
determines their fate according to mathematical rules based on the values of
voxels in the volume, and builds a two-dimensional image from the results of
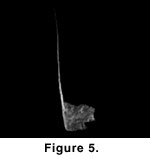
these calculations. We have used mean-intensity volume rendering, where the
final intensity of the virtual ray is determined by the mean values of the
voxels it encounters. This algorithm produces a virtual X-ray image of the
volume from any angle the user chooses (Figure
5). Like true X-radiographs, the images are a relatively poor aid to
visualizing the outer surface of objects, but are effective for imaging of large
or strongly absorbent (=dark) structures that otherwise may be obscured by less
substantial features.
Volume
rendering. There are various techniques, collectively known as volume
rendering, for the direct visualization of volume data . Although they vary in
detail, all involve forms of ray casting, where the computer calculates an
array of virtual light rays shone into the volume from a specified angle,
determines their fate according to mathematical rules based on the values of
voxels in the volume, and builds a two-dimensional image from the results of
these calculations. We have used mean-intensity volume rendering, where the
final intensity of the virtual ray is determined by the mean values of the
voxels it encounters. This algorithm produces a virtual X-ray image of the
volume from any angle the user chooses (Figure
5). Like true X-radiographs, the images are a relatively poor aid to
visualizing the outer surface of objects, but are effective for imaging of large
or strongly absorbent (=dark) structures that otherwise may be obscured by less
substantial features.
 Isosurfaces.