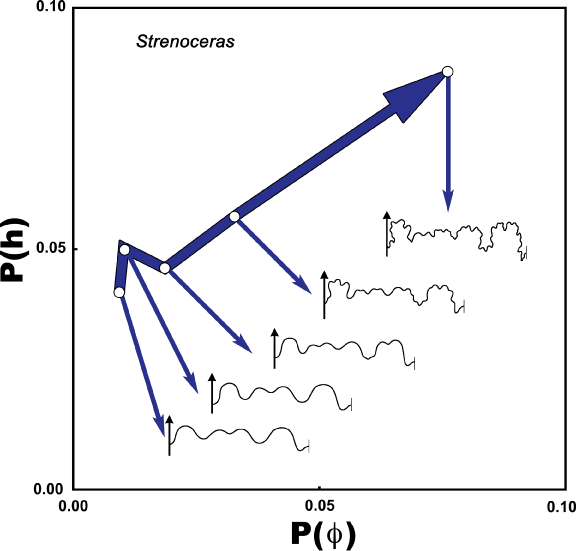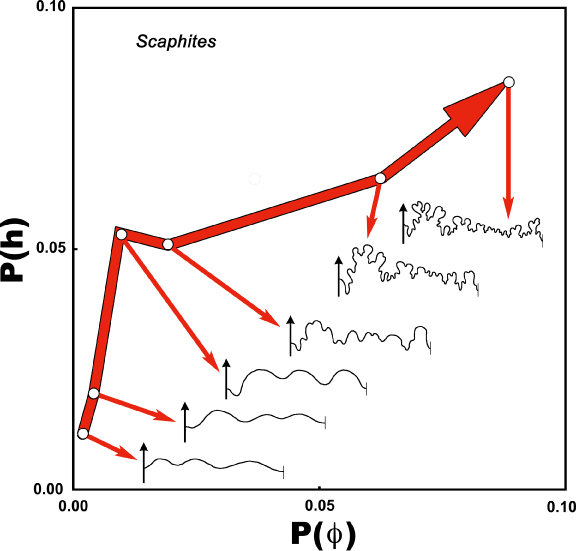

Figure 6. Plot of Power(phi) and Power(h) for suture patterns in the ontogenetic series of Strenoceras (6a) and Scaphites (6b). The trend of power through the ontogeny is indicated by the thick, bent arrow, with the arrow head at the mature suture pattern. Colored arrows connect the point plotted to the suture pattern. Early in ontogeny, h-amplitudes increase relatively faster than phi, then enter a stage in which the relationship is reversed.
6A.

6B.
