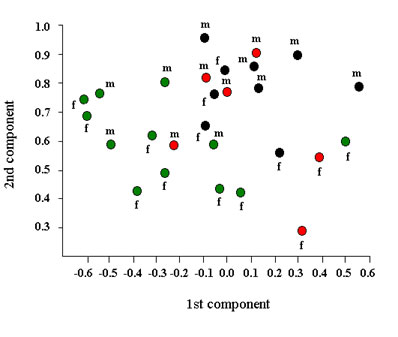
Figure 8. Plot of the 1st vs. 2nd eigenshape components of the three studied species. Coloured circles the same as in Figure 7.