 The program for relative warps analysis was written by
Rohlf (1998b, version 1.2).
The program for relative warps analysis was written by
Rohlf (1998b, version 1.2).
The program for relative warps analysis was written by
Rohlf (1998b, version 1.2).
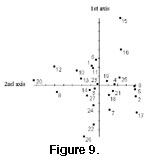
Non-affine Shape Differentiation in the Three Forms. The ordination for the 1st and 2nd warps
(Figure 9) represents the non-affine (= non-uniform) shape variation. The first singular value for these data constitutes 20.85% of the variance, the second one comprises 17.59% of the variance, the third one is 15.33% and the fourth one is 13.03%. Thus, more than 66% of the variance is included within the first four relative warps, which is sufficient for interpreting the shape variation within the studied data.
Figure 9 shows a plot of the 1st vs. 2nd relative warps and indicates that the 1st relative warp has a tendency to separate most specimens with acute posterior ends (at the left; like 20, 12, 8, 10, 13) from those with broad posterior ends (at the right; like 17, 2, 9, 15, 16).
 The 2nd relative warp shows no distinct relation between the specimens studied.
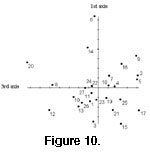
Figure 10 compares the 1st vs. 3rd relative warps and shows that the 3rd axis separates most male specimens (in the upper section; like 14, 9, 20, 16) from females (in the lower section; like 15, 3, 21, 12).
The 2nd relative warp shows no distinct relation between the specimens studied.
Figure 10 compares the 1st vs. 3rd relative warps and shows that the 3rd axis separates most male specimens (in the upper section; like 14, 9, 20, 16) from females (in the lower section; like 15, 3, 21, 12).
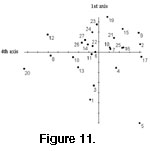 Figure 11, plotting the 1st vs. 4th axes, shows a tendency for the 4th axis to separate suboval shapes (in the upper section; like 19, 23, 15, 24, 9, 12, 21) from subtriangular ones (in the lower section; like 1, 3, 4, 20, 13).
Affine Shape Differentiation in the Three Forms.
Although this study does not deal with growth, the uniform relative warps analysis is expected to give additional information about the growth of these ostracods because most growth in crustacean shells is of uniform (= affine) origin owing to the molting process.
Figure 12, which plots the 1st vs. 2nd uniform axes, shows the tendency to separate most of the specimens of
D. ismaili (Bassiouni) in the upper section of the graph, and most specimens of
C.? sp. in the lower section of the graph. 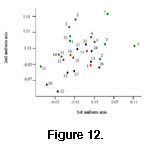 Specimens of Digmocythere omarai Cronin and Khalifa are distributed between these two species. It is clear that the affine differentiation
can successfully differentiate between most females (at the upper section; like 7, 8, 3, 10) from most males (at the lower section; like 25, 20, 19,
27). Unexpectedly, the affine projection does not appear to provide additional information about the relationship between the three studied forms. Like the results of the distance measurements, there is a strong overlap between the three forms studied.
Specimens of Digmocythere omarai Cronin and Khalifa are distributed between these two species. It is clear that the affine differentiation
can successfully differentiate between most females (at the upper section; like 7, 8, 3, 10) from most males (at the lower section; like 25, 20, 19,
27). Unexpectedly, the affine projection does not appear to provide additional information about the relationship between the three studied forms. Like the results of the distance measurements, there is a strong overlap between the three forms studied.
 The program used for the thin plate spline analysis is that of
Rohlf (1997, version 2.13). This technique is a graphical representation of mapping from one shape to another. Left views of three females of the three studied forms (one specimen for each) were considered as typical (reference) specimens for the analysis.
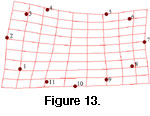
Figure 13 portrays the mapping of the non-affine case of
Digmocythere ismaili into C.? sp. and suggests strong deformation, coupled with a bending energy of 0.11407. The posterior zone is more affected than the anterior zone. A weak dilatation towards the anterior margin and strong dorsal compression are detected.
Figure 14 displays the warp of
Digmocythere ismaili into D. omarai. The bending energy is 0.06381, and the effect is not so strong. The figure shows that the
postero-dorsal margin is more affected than other sides.
The program used for the thin plate spline analysis is that of
Rohlf (1997, version 2.13). This technique is a graphical representation of mapping from one shape to another. Left views of three females of the three studied forms (one specimen for each) were considered as typical (reference) specimens for the analysis.
Figure 13 portrays the mapping of the non-affine case of
Digmocythere ismaili into C.? sp. and suggests strong deformation, coupled with a bending energy of 0.11407. The posterior zone is more affected than the anterior zone. A weak dilatation towards the anterior margin and strong dorsal compression are detected.
Figure 14 displays the warp of
Digmocythere ismaili into D. omarai. The bending energy is 0.06381, and the effect is not so strong. The figure shows that the
postero-dorsal margin is more affected than other sides. 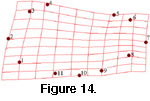 There is strong dorsal compression and posterior-anterior dilatation that increases in the anterior direction.
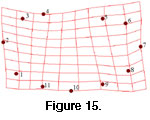
Figure 15, showing the warp of
Digmocythere omarai into C.? sp., suggests that the deformation is greater than the previous two cases, with bending energy equal 0.24868. The posterior zone is more affected than the anterior one, and there is a weak dilatation toward the posterior margin and a strong dorsal compression.
There is strong dorsal compression and posterior-anterior dilatation that increases in the anterior direction.
Figure 15, showing the warp of
Digmocythere omarai into C.? sp., suggests that the deformation is greater than the previous two cases, with bending energy equal 0.24868. The posterior zone is more affected than the anterior one, and there is a weak dilatation toward the posterior margin and a strong dorsal compression.
 The three comparisons indicate that the postero-dorsal zone is the most affected area in the three cases.
Digmocythere omarai and C.? sp. show the most divergent shape categories, while
Digmocythere ismaili and D. omarai exhibit convergent shape categories.
The three comparisons indicate that the postero-dorsal zone is the most affected area in the three cases.
Digmocythere omarai and C.? sp. show the most divergent shape categories, while
Digmocythere ismaili and D. omarai exhibit convergent shape categories.
![]()