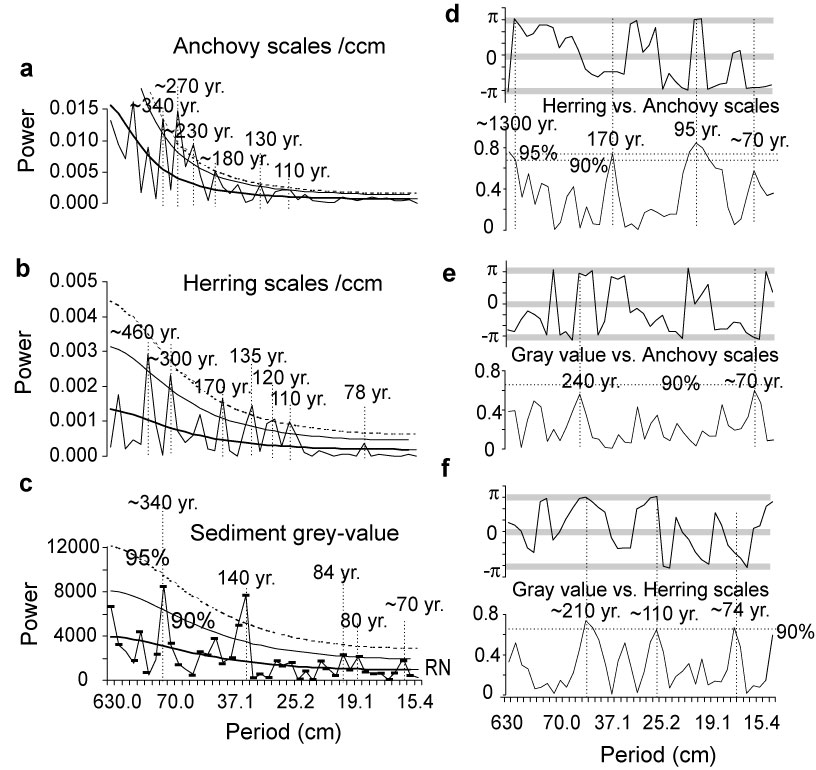
Figure 10. Spectral analysis periodograms
with red noise levels (RN), as well as 90% and 95% non-randomness confidence
levels (see text for details) for anchovy (a), herring (b), and sediment
gray-scale value data (c), for the interval from 287-920 cm depth. Periods in
years are based on a constant sedimentation rate of 0.23cm/year. Standard error
for bandwidth of cycles due to standard error of 14C data is ±7
percent. Black bars mark bandwidth error for each period. d-f: Cross-spectral
analysis utilizing a 5-point-lag Hamming window for gray-scale value data with
anchovy and herring scale abundances: squared coherency (bottom) and phase
spectrum (+![]() to -
to -
![]() ) at top:
horizontal gray bars mark in-phase (+) or inverse () cross-correlation.
Dotted vertical lines mark periods that are cross-correlated. Dotted horizontal
lines mark 90% and 95% confidence level (calculated from the F-distribution). Note
that most of the significant periods in (d) have negatively cross-correlated
amplitudes and are phase shifted (i.e., they are not directly correlated in
time) except for the 56-57, 74, and 77 year periods. These intervals show an
in-phase correlation between bright sediments and herring and a negative cross
correlation (+/
) at top:
horizontal gray bars mark in-phase (+) or inverse () cross-correlation.
Dotted vertical lines mark periods that are cross-correlated. Dotted horizontal
lines mark 90% and 95% confidence level (calculated from the F-distribution). Note
that most of the significant periods in (d) have negatively cross-correlated
amplitudes and are phase shifted (i.e., they are not directly correlated in
time) except for the 56-57, 74, and 77 year periods. These intervals show an
in-phase correlation between bright sediments and herring and a negative cross
correlation (+/ ![]() )
between herring and anchovy and gray-scale values and anchovy. Note that the
strong decrease in power with decreasing period is primarily the result of
non-equidistant sampling with the fish data.
)
between herring and anchovy and gray-scale values and anchovy. Note that the
strong decrease in power with decreasing period is primarily the result of
non-equidistant sampling with the fish data.