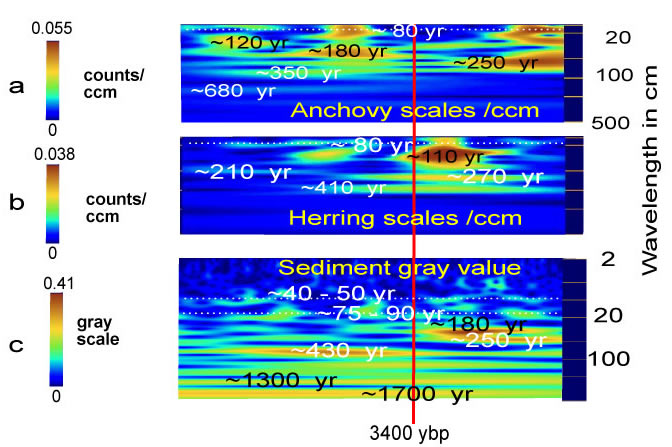
Figure 11. Wavelet analyses for the predominantly well-laminated and densely fish-sampled core interval from 287-920 cm deposited between 1,800 and 4,500 years BP based on 14C dates. Wavelet analysis of (a, b) different types of fish abundance data, from the absolute abundance of scales/cm3, (c) gray-scale value x-ray image line scan data from sediment core. The duration for cycle lengths inside the wavelet scalograms are according to a mean sedimentation rate of 0.23 cm/yr. Color codes for wavelet coefficients (in amplitudes of periodic cycles) on left sides of scalograms. Vertical red line marks an abrupt jump in the wavelet coefficients at ~720 cm (~3,400 years BP). Vertical scale for e-g is logarithmically scaled.