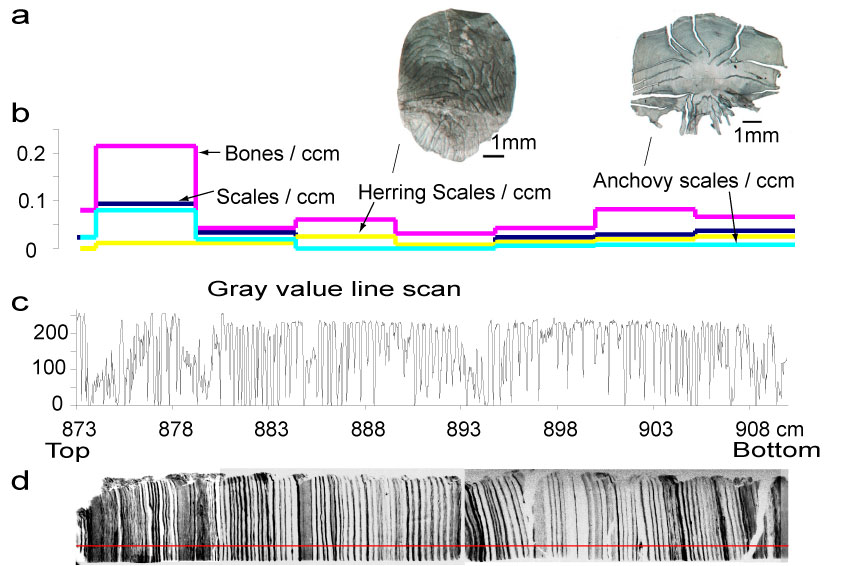
Figure 7. Fish-scale abundance and x-ray coloration for the laminated core interval from 873-910 cm of core TUL99B03. (a). Herring and anchovy fish scales. (b). Record of fish scales and fish bones/cm3. Note that anchovy scales are more common in dark sediments. (c). Gray-scale values derived from scan along red line in x-ray segment (d), where a value of 255=white and 0=black.