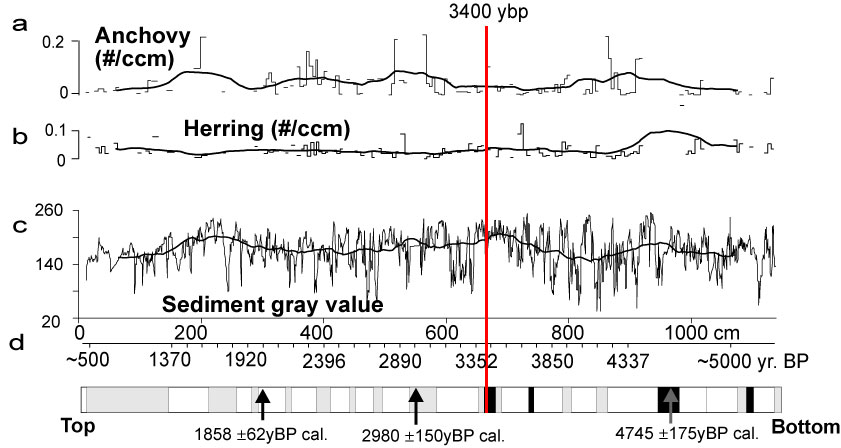
Figure 8. Core TUL99B03 from 0-1230 cm below sea bottom. (a). Anchovy record (scale counts/ cm3) including a 2 m moving average (bold line). (b). Herring record (scale counts/cm3) including a 2 m moving average (bold line). (c). Sediment gray-scale value (derived from x-ray images) including a 2 m moving average (bold line). X-ray images were scanned at 256 gray-scale values to produce 130,787 vertically measured pixels based on a ratio of 116 pixels = 1 cm; 1 data point = 100 pixels, resulting in 1309 data points. As a result of lost core or poor image quality, 7.4 % of the data was deleted. Data loss was minimized because line scans of the core were carried out in three parallel line scans that permitted the negative impact of cracks in the core and other gaps to be minimized. (d). Time-scale derived from linear regression of three calibrated 14C ages. Note that the time-scale on top and bottom of core is uncertain, and ages are extrapolated. Generalized core lithology with white intervals representing well-laminated sediments, gray intervals represent poorly-laminated core intervals, and black intervals represent non-laminated, or otherwise disturbed laminations (e.g., as a possible result of seismic shaking).