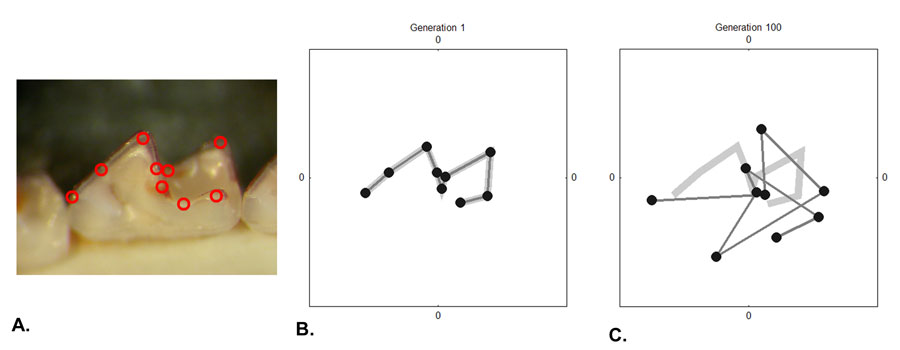
Figure 1. The effect of simulating the evolution of morphological shape without a covariance matrix. A. Landmarks used to represent the shape of the crown of the upper first molar of Sorex araneus (Lipotyphla, Mammalia). B. Configuration of landmarks at the beginning of the simulation. Black dots connected by thin, dark lines show the positions of landmarks, and the thick, light grey line represents the initial position. C. The configuration of landmarks after 100 generations of random evolution. Anatomically adjacent landmarks become unrealistically entwined when structural correlations are not included in the simulation model. D. Animation of the complete simulation.